Fig. 3
Download original image
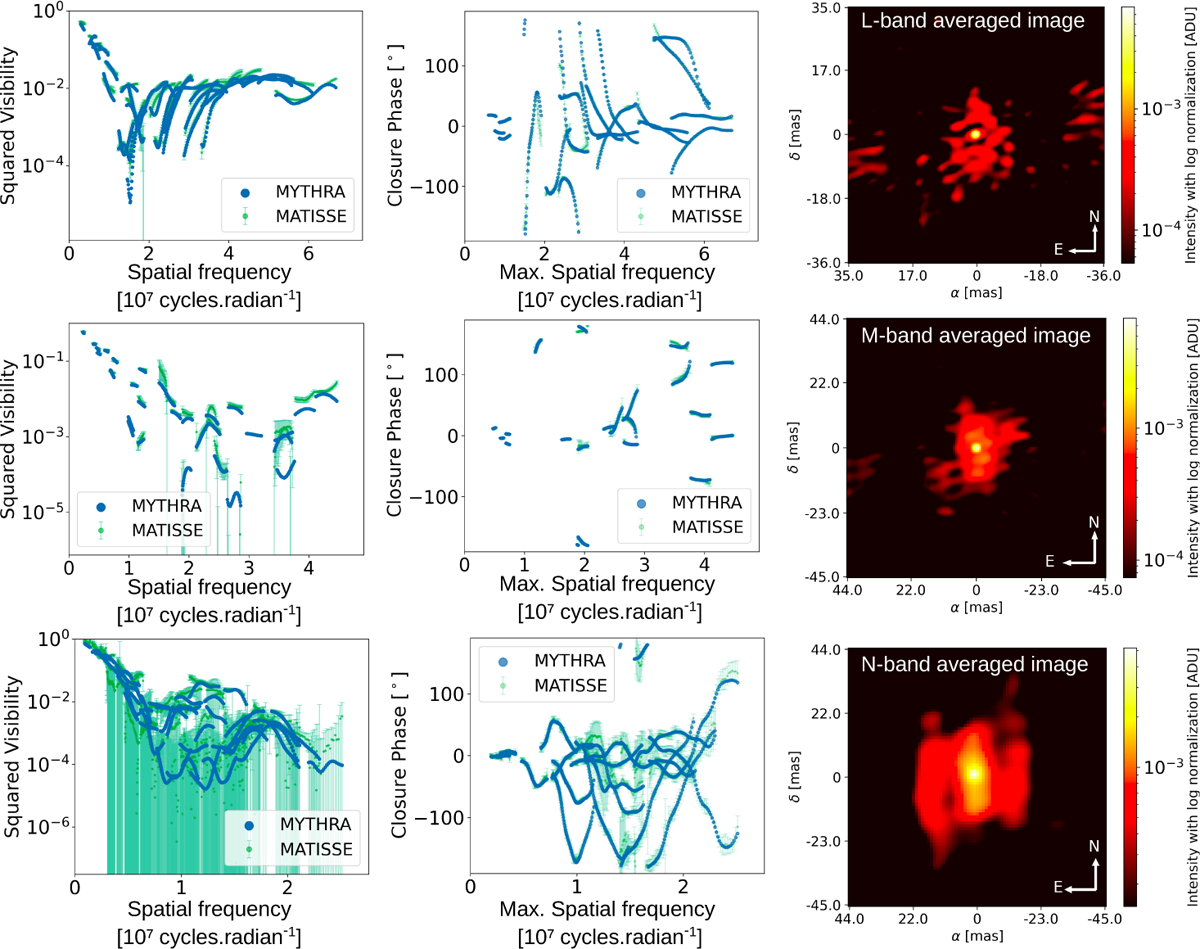
Comparison between the interferometric observables extracted from the MYTHRA averaged images (in blue) and the VLTI/MATISSE data of 3 Puppis (in green), shown respectively in the L-band (first row ), in the M-band ( second row ), and in the N-band ( third row ). Left column : squared visibility amplitudes as a function of spatial frequency in logarithmic scale. Central column : closure phases as a function of spatial frequency, computed using the longest baseline. Right column : final averaged images resulting from MYTHRA, normalised to unity (i.e. the sum over all pixels equals one), with a logarithmic colour scaling, and not convolved with the interferometric beam. The minimum value for each brightness scaling is set to half the standard deviation of the associated image to filter out the artefact produced by the MiRA algorithm.
Current usage metrics show cumulative count of Article Views (full-text article views including HTML views, PDF and ePub downloads, according to the available data) and Abstracts Views on Vision4Press platform.
Data correspond to usage on the plateform after 2015. The current usage metrics is available 48-96 hours after online publication and is updated daily on week days.
Initial download of the metrics may take a while.