Fig. 4
Download original image
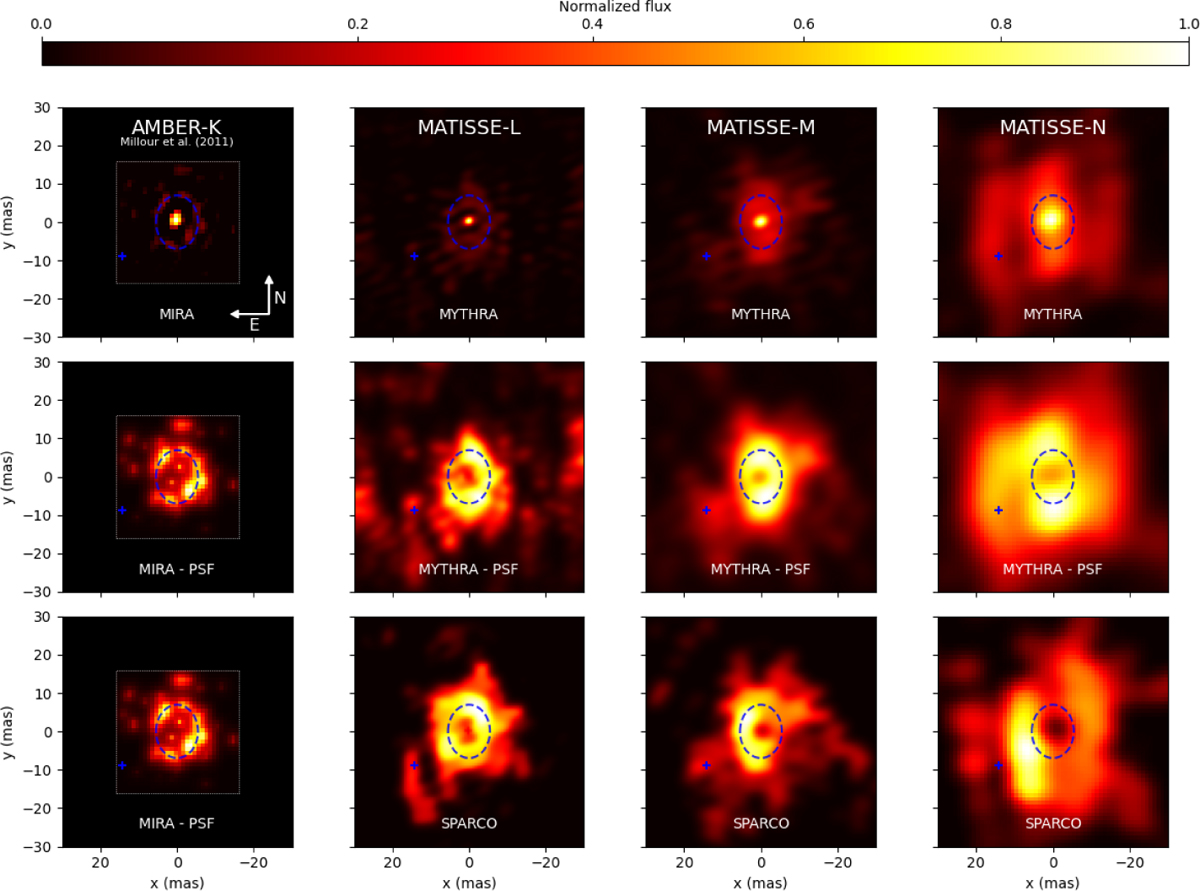
Final image reconstructions of 3 Puppis in the mid-infrared using MiRA, MYTHRA, and SPARCO imaging tools. The FoV for each image is (60 mas × 60 mas) with north up and east left. The dashed blue ellipse indicates the best-fit inner rim of the dusty disc derived from VLTI/AMBER data, while the blue cross marks the SE elongated clump best-fit position, denoted Rref, from MATISSE L-band geometric modelling (at a distance of 16.71 ± 0.03 mas from the image centre). Brightness colour scale is normalised to peak intensity (i.e. maximum pixel value). K-band image : the left-most column shows the images obtained with VLTI/AMBER data by Millour et al. (2011). In the first row the median MiRA image is displayed, and the last two rows present the identical convolved median MiRA image with the λ/2 B max PSF subtraction applied. L-M-N-bands images : the remaining three columns display the images obtained with VLTI/MATISSE. On the first row the resulting MYTHRA averaged image is shown. The second row shows the convolved image of MYTHRA with the λ/2Bmax PSF subtraction applied. The last row gives the resulting SPARCO image, convolved with the interferometric beam.
Current usage metrics show cumulative count of Article Views (full-text article views including HTML views, PDF and ePub downloads, according to the available data) and Abstracts Views on Vision4Press platform.
Data correspond to usage on the plateform after 2015. The current usage metrics is available 48-96 hours after online publication and is updated daily on week days.
Initial download of the metrics may take a while.