Fig. 6
Download original image
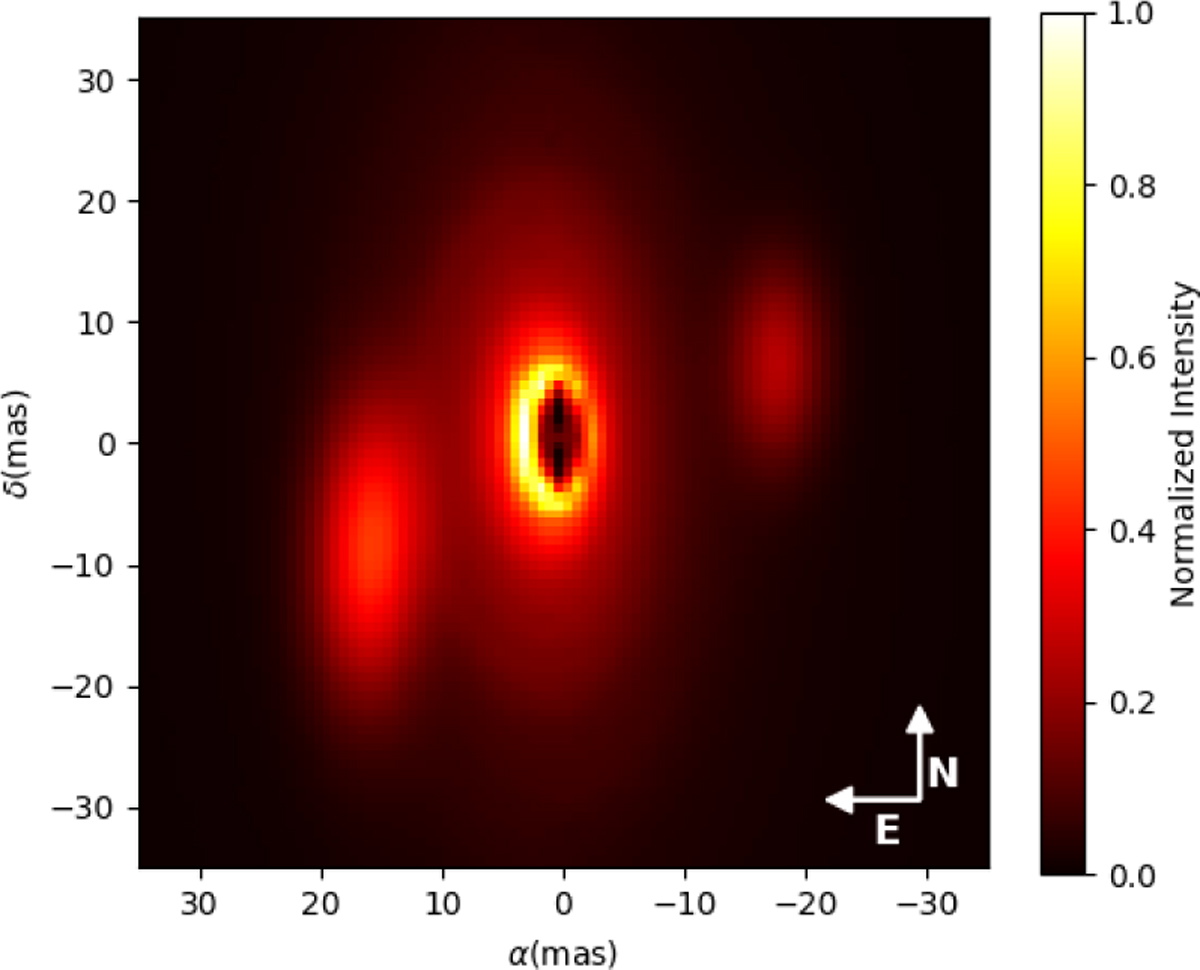
Best-fit image at 10 μm using the N-band MATISSE data of 3 Puppis. The fit is performed combining MC3D code with two elliptical Gaussian disc models ({MC3D + 2EG} model) to describe the asymmetries revealed by MYTHRA and SPARCO image reconstructions. The model fitting results in a reduced chi-squared value of 24. East corresponds to increasing x-axis values, and north to increasing y-axis values.
Current usage metrics show cumulative count of Article Views (full-text article views including HTML views, PDF and ePub downloads, according to the available data) and Abstracts Views on Vision4Press platform.
Data correspond to usage on the plateform after 2015. The current usage metrics is available 48-96 hours after online publication and is updated daily on week days.
Initial download of the metrics may take a while.