Fig. 7
Download original image
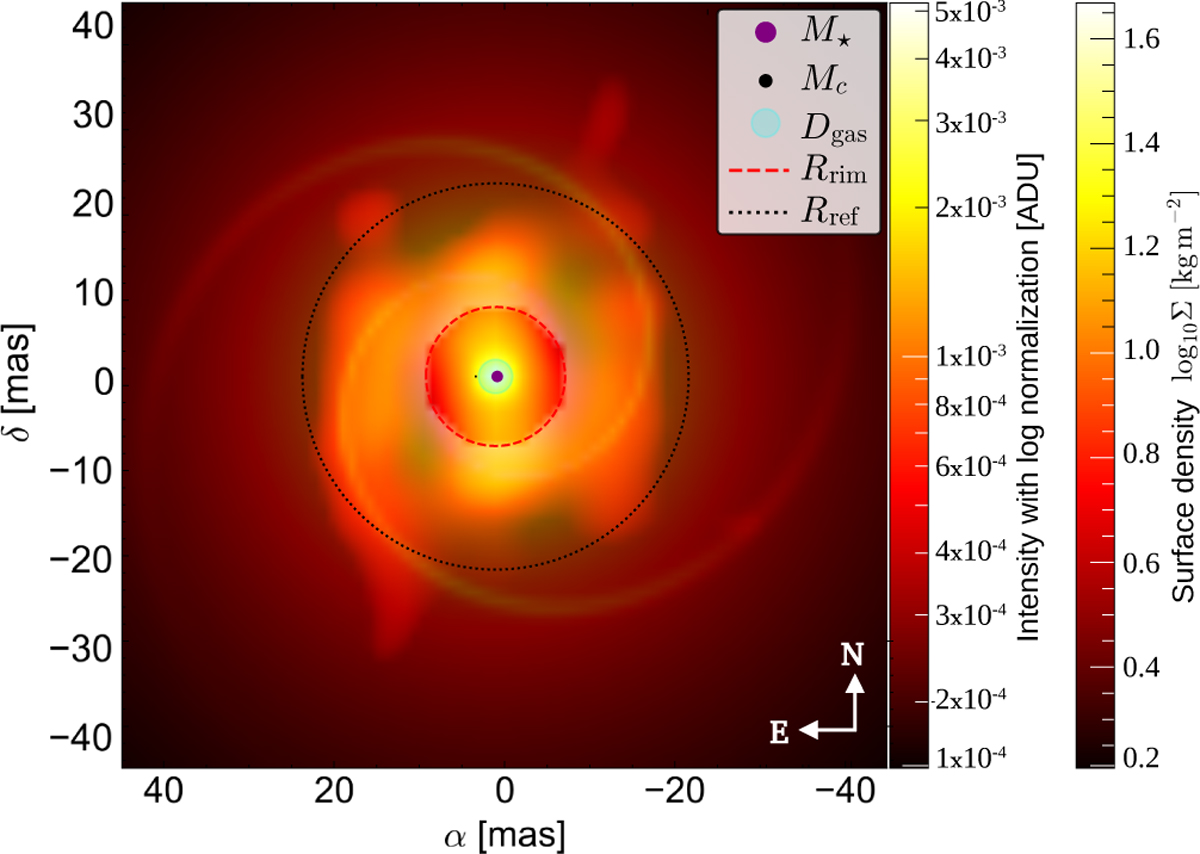
Composite image showing the analytic spiral model superimposed on the reconstructed N-band MYTHRA image of 3 Puppis. The logarithmic colour scale represents the observed intensity of the N-band image (normalised to unity and expressed in ADU), while the spiral model is overlaid as a semi-transparent structure representing the local gas surface density normalised to 20% contrast. The red dashed circle marks the inner dust rim (Rrim ≃ 5.7 mas), and the black dotted circle indicates the radius of the SE asymmetric structure (Rref ≃ 16.71 mas) inferred from the L-band MYTHRA image. The curvature and radial extent of the two logarithmic spiral arms closely match the two asymmetries observed in the N-band image, located in the SE and NW regions of the dusty disc.
Current usage metrics show cumulative count of Article Views (full-text article views including HTML views, PDF and ePub downloads, according to the available data) and Abstracts Views on Vision4Press platform.
Data correspond to usage on the plateform after 2015. The current usage metrics is available 48-96 hours after online publication and is updated daily on week days.
Initial download of the metrics may take a while.