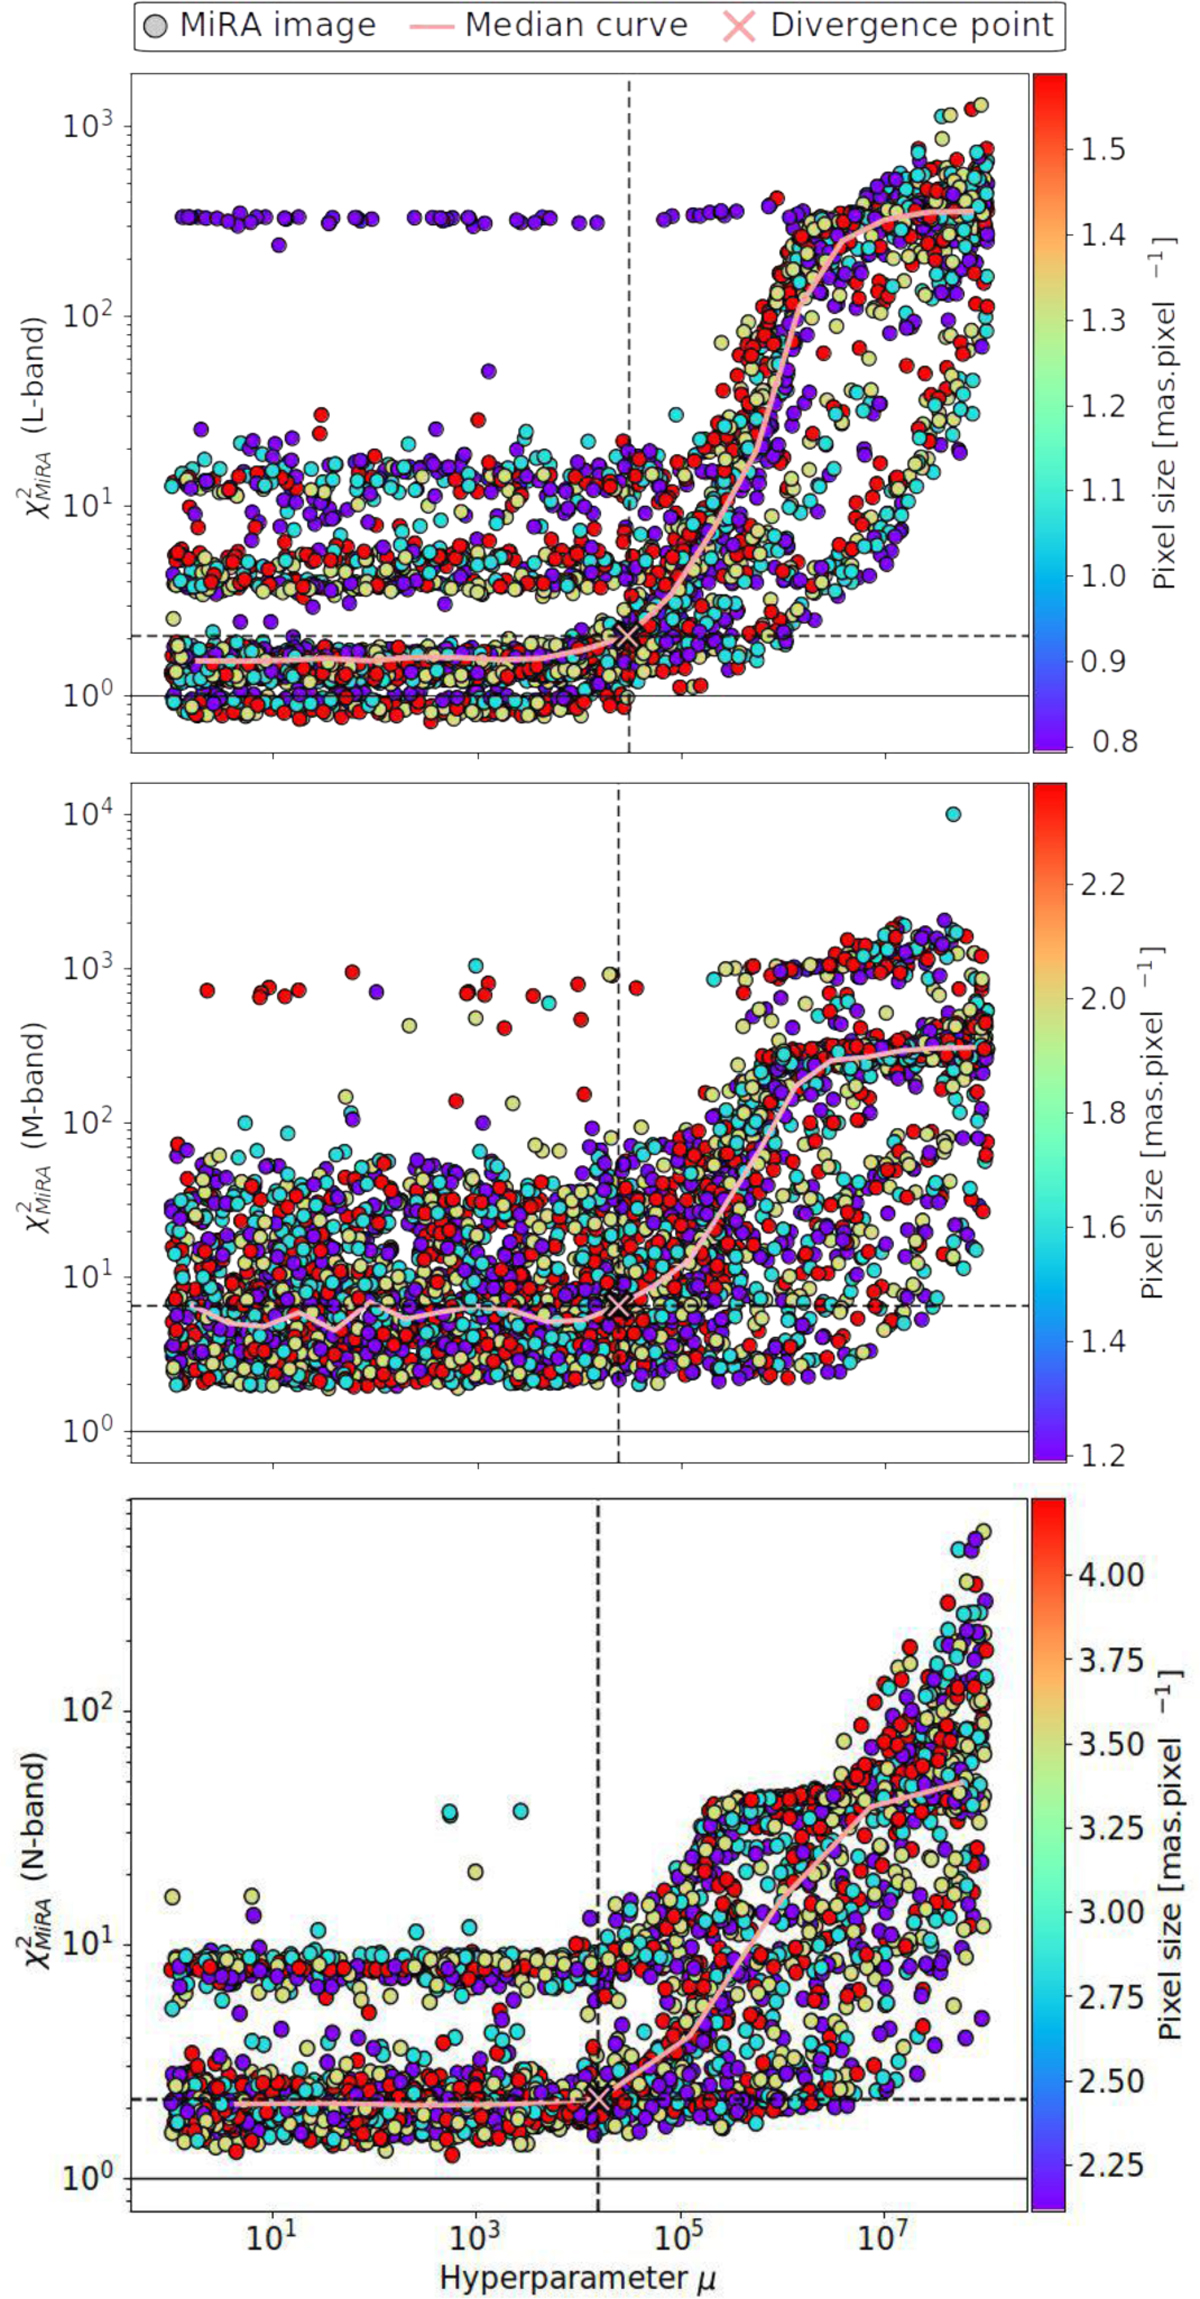
Fig. B.1
Download original image
L-curves of the MiRA images reconstructed using the VLTI/MATISSE 3 Puppis data, and for each spectral band. The median curve resulting from the data binning performed by MYTHRA is shown by the solid black line, and the pink cross indicates the inflection point, corresponding to the optimal hyperparameter value. Each coloured dot represents one of the 3360 reconstructed images generated by the PYRA grid. The colourmap reflects the pixel size value used to reconstruct the circumstellar environment. Top plot : L-band. Centre plot : M-band. Bottom plot : N-band.
Current usage metrics show cumulative count of Article Views (full-text article views including HTML views, PDF and ePub downloads, according to the available data) and Abstracts Views on Vision4Press platform.
Data correspond to usage on the plateform after 2015. The current usage metrics is available 48-96 hours after online publication and is updated daily on week days.
Initial download of the metrics may take a while.