Fig. 4
Download original image
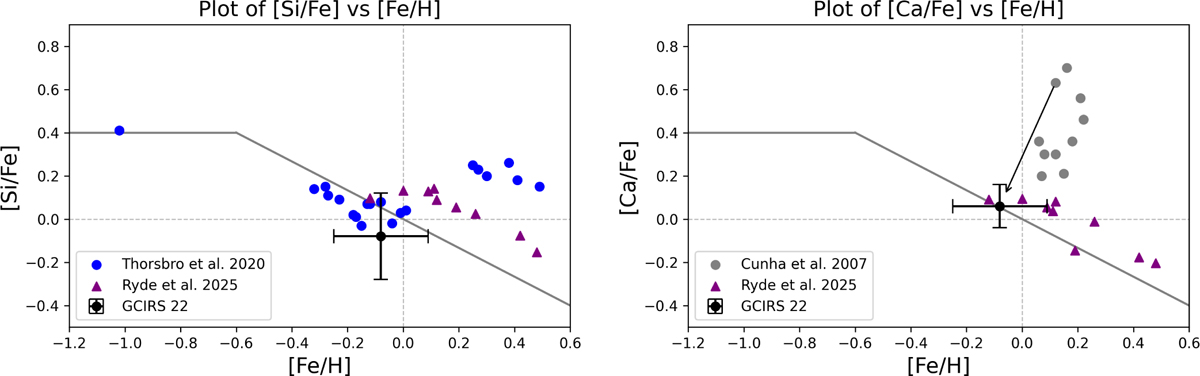
Left panel: silicon over iron abundance ratio versus iron abundance, plotting the value obtained for GCIRS 22 and comparing to literature results for the Milky Way nuclear star cluster (Thorsbro et al. 2020; Ryde et al. 2025). Right panel: calcium over iron abundance. The grey dots are the results from Cunha et al. (2007) with an arrow indicating the changed value for GCIRS 22. The primary reason for the new value of calcium abundance for GCIRS 22 is the taking into account of NLTE effects, and there is thus likely to be a similar reduction of calcium abundance in the remaining set from Cunha et al. (2007). The grey line is an ‘alpha-knee’ model for a simplified Milky Way bulge chemical evolution scenario over-plotted for convenience (Matteucci 2012).
Current usage metrics show cumulative count of Article Views (full-text article views including HTML views, PDF and ePub downloads, according to the available data) and Abstracts Views on Vision4Press platform.
Data correspond to usage on the plateform after 2015. The current usage metrics is available 48-96 hours after online publication and is updated daily on week days.
Initial download of the metrics may take a while.