| Issue |
A&A
Volume 704, December 2025
|
|
|---|---|---|
| Article Number | A62 | |
| Number of page(s) | 8 | |
| Section | Galactic structure, stellar clusters and populations | |
| DOI | https://doi.org/10.1051/0004-6361/202556618 | |
| Published online | 03 December 2025 | |
Supergiant GCIRS 22 in the Milky Way nuclear star cluster: Revised alpha abundances
1
Université Côte d’Azur, Observatoire de la Côte d’Azur, CNRS, Laboratoire Lagrange,
06000
Nice,
France
2
Division of Astrophysics, Department of Physics, Lund University,
Box 118,
S22100
Lund,
Sweden
3
Department of Astronomy, Graduate School of Science, The University of Tokyo,
7-3-1 Hongo, Bunkyo-ku,
Tokyo
113-0033,
Japan
4
MAUCA – Master track in Astrophysics, Université Côte d’Azur, Observatoire de la Côte d’Azur,
Parc Valrose,
06100
Nice,
France
5
Department of Physics and Astronomy, UCLA,
430 Portola Plaza,
Box 951547,
Los Angeles,
CA
90095-1547,
USA
6
Department of Physics, Tokyo Metropolitan University,
1-1 Minami-Osawa, Hachioji,
Tokyo
192-0397,
Japan
7
National Astronomical Observatory of Japan,
2-21-1 Osawa, Mitaka,
Tokyo
181-8588,
Japan
8
Theoretical Astrophysics, Department of Physics and Astronomy, Uppsala University,
751 20
Uppsala,
Sweden
9
Aryabhatta Research Institute of Observational Sciences,
Manora Peak,
Nainital
263002,
India
10
Miyagi University of Education,
149 Aramaki-Aza-Aoba, Aoba-ku, Sendai,
Miyagi
980-0845,
Japan
★ Corresponding author: This email address is being protected from spambots. You need JavaScript enabled to view it.
Received:
27
July
2025
Accepted:
21
September
2025
Abstract
Context. The chemical abundances of alpha elements in Galactic Centre (GC) supergiants provide key insights into the chemical enrichment and star formation history of the Milky Way’s nuclear star cluster. Previous studies have reported enhanced alpha-element abundances, which raises questions about the chemical evolution of this unique region.
Aims. We aim to reassess the alpha-element abundances in the GC supergiant GCIRS 22 using updated spectral modelling and non-local thermodynamic equilibrium (NLTE) corrections to resolve discrepancies from earlier abundance analyses.
Methods. We analysed high-resolution near-infrared spectra of GCIRS 22 using contemporary line lists and precise stellar parameters derived from scandium line diagnostics. We applied comprehensive NLTE corrections to accurately determine the abundances of silicon and calcium.
Results. Our analysis reveals solar-scale alpha abundances ([Ca/Fe] = 0.06 ± 0.07; [Si/Fe] = than −0.08 ± 0.20) for GCIRS 22, which are significantly lower than previous local thermodynamic equilibrium (LTE) based findings. NLTE corrections reduce the calcium abundance by approximately 0.3 dex compared to LTE estimates; this aligns our results with recent studies and highlights the importance of accurate NLTE modelling.
Conclusions. The solar-scale alpha-element abundances observed in GCIRS 22 suggest that recent star formation in the region has not been dominated by Type II supernovae, such as those expected from a recent starburst. Our findings support a scenario of episodic star formation, characterized by intermittent bursts separated by extended quiescent phases, or potentially driven by gas inflows from the inner disc, funnelled by the Galactic bar. Future comprehensive NLTE studies of additional GC stars will be essential for refining our understanding of the region’s chemical evolution and star formation history.
Key words: stars: abundances / stars: late-type / supergiants / Galaxy: abundances / Galaxy: nucleus / Galaxy: stellar content
© The Authors 2025
 Open Access article, published by EDP Sciences, under the terms of the Creative Commons Attribution License (https://creativecommons.org/licenses/by/4.0), which permits unrestricted use, distribution, and reproduction in any medium, provided the original work is properly cited.
This article is published in open access under the Subscribe to Open model. This email address is being protected from spambots. You need JavaScript enabled to view it. to support open access publication.
1 Introduction
The Galactic Centre (GC) hosts the Milky Way’s nuclear star cluster (NSC), a dense, massive stellar system that serves as a unique laboratory for probing star formation, chemical enrichment, and dynamical evolution in extreme environments (Neumayer et al. 2020; Feldmeier-Krause et al. 2025). Alongside the nuclear stellar disc (NSD) and the central molecular zone, the NSC forms a complex ecosystem that holds critical clues to the Milky Way’s formation history and the role of galactic nuclei in galaxy evolution (Schödel et al. 2023; Solanki et al. 2023). Accurate chemical characterization of its stellar populations is key to unravelling these processes.
The GC’s structure is defined by three primary components: (1) the NSC, a compact, spherical system with a half-light radius of ∼4 pc, a diameter of ∼12 pc (∼300′′), and a mass of 2 × 10⁷ M⊙ (Schödel et al. 2014; Gallego-Cano et al. 2020); (2) the NSD, a rotating disc with a break radius of ~90 pc, a scale height of ∼45 pc, and a mass of 1 × 10⁹ M⊙ (Launhardt et al. 2002; Bland-Hawthorn & Gerhard 2016); and (3) the central molecular zone, a ∼250 × 50 pc molecular gas complex (Henshaw et al. 2023). Embedded within the Galactic bulge, these structures constitute the Milky Way’s largest reservoir of dense gas, which is sustained by bar-driven inflows (Baba & Kawata 20200; Sormani et al. 2022).
Star formation in the GC has been episodic, with evidence of both ancient (8–10 Gyr) and recent (<10 Myr) populations (Matsunaga et al. 2011; Nogueras-Lara et al. 2020; Schödel et al. 2020; Thorsbro et al. 2023). While the NSC and NSD exhibit distinct star formation histories, kinematic and metallicity gradients suggest a smooth transition between them, which possibly indicates a shared origin (Nogueras-Lara et al. 2023). The NSC’s star formation history remains debated: studies propose either a predominantly old (>10 Gyr) population with minor intermediate-age (∼3 Gyr) and young (<100 Myr) components (Schödel et al. 2020; Nogueras-Lara et al. 2021), or a dominant ∼5 Gyr population (Chen et al. 2023). Resolving this requires precise chemical abundances, particularly for young-and intermediate-age candidates identified by Nishiyama et al. (2016, Nishiyama et al. 2023).
Nuclear star clusters are ubiquitous in galaxies with masses ≳108–1010 M⊙ and often coexist with supermassive black holes, their masses scaling with host galaxy properties (Neumayer et al. 2020; Kormendy & Ho 2013; Georgiev et al. 2016). Two primary formation channels have been proposed: (1) globular cluster infall via dynamical friction (on timescales of 1 Gyr; (Tremaine et al. 1975; Hartmann et al. 2011; Antonini et al. 2012; Tsatsi et al. 2017)) and (2) in situ star formation from accreted gas (Loose et al. 1982; Nayakshin & Cuadra 2005). A hybrid scenario may explain the NSC’s complex population (Arca Sedda et al. 2020), with chemical abundances serving as critical diagnostics.
Recent advancements in high-resolution, near-infrared spectroscopy have enabled detailed chemical analyses despite significant optical extinction towards the Galactic centre. These investigations have demonstrated that stars within the NSC exhibit a broad metallicity range and distinct chemical abundance patterns; these reflect complex star formation histories that involve multiple episodes of stellar birth, potentially driven by in situ formation from gas funnelled into the Galactic centre or through infalling stellar clusters (Thorsbro et al. 2020; Bentley et al. 2022; Thorsbro et al. 2023; Nishiyama et al. 2024; Nandakumar et al. 2025; Ryde et al. 2025; Feldmeier-Krause et al. 2025).
The red supergiant population represents the most recent generation of star formation in the Galactic Centre and reflects what can be assessed as closest to the present-day composition of the interstellar medium. As supergiant stars are cool and luminous, they are in principle amenable to high-resolution abundance analysis, although approaches and techniques have evolved since the pioneering work of Ramírez et al. (2000) and Cunha et al. (2007). Among the most significant findings of Cunha et al. (2007) are striking +0.3 dex enhancements of alpha elements, especially oxygen and calcium, in the supergiant population. Save for one local thermodynamic equilibrium (LTE) analysis of the Galactic Centre supergiants GCIRS 7 and VR 5–7 (Davies et al. 2009), the consensus reports elevated abundance ratios in this population, relative to other studies (Ryde et al. 2025); hence the subject is worth revisiting.
Recent work by Thorsbro et al. (2020) has further identified an enhanced silicon abundance at supersolar metallicities within the NSC, which highlights the uniqueness of the alpha-element enrichment processes occurring in this region. In their discussion, Thorsbro et al. (2020) suggest that the alpha-enhanced, metal-rich stars in the NSC could either be young or old, depending on their formation and chemical evolution histories. Profiting from the young age of supergiants, the study of supergiants offers an excellent opportunity to test these scenarios and refine our understanding of the origins of alpha-enhanced populations in the Galactic centre.
Guerço et al. (2022a) extended abundance analyses beyond the alpha elements by including fluorine in NSC giants, thereby broadening the chemical inventory. Further, Guerço et al. (2022b) showed that GCIRS 7 is fluorine-poor, a CNO-cycle dredge-up signature that highlights fluorine as a tracer of internal mixing in massive red supergiants.
The identification of multiple dynamical substructures within the NSC, including distinct stellar discs characterized by varying eccentricities and orbital orientations, further emphasizes the complexity of its formation and evolutionary processes (Jia et al. 2023). The coexistence of young stars and older, metal-poor populations suggests ongoing or episodic star formation activities, possibly associated with transient and dynamic gas inflow mechanisms (Thorsbro et al. 2023). Moreover, unique chemical signatures, such as enhanced sodium abundances, indicate uncommon nucleosynthetic pathways or specific environmental conditions prevalent in the Galactic centre region (Ryde et al. 2025).
Research focusing on individual stars, such as the red super-giant GCIRS1 22, provides valuable insight into the chemical enrichment and stellar-evolution processes that shape the NSC. Together with GCIRS 7 and GCIRS 19, GCIRS 22 is one of only three confirmed red supergiants within the central ~1 pc of the Galaxy (Blum et al. 1996; Ramírez et al. 2000; Blum et al. 2003). Its extreme luminosity and relative isolation make it an ideal target for high-resolution infrared spectroscopy. In this study we analyse Keck II/NIRSPEC observations of GCIRS 22 and compare the derived abundances and stellar parameters with those obtained in earlier studies. In the future, conclusions achieved from the study of GCIRS 22 could potentially be extrapolated to the previously obtained results from the other supergiants studied by Ramírez et al. (2000) and Cunha et al. (2007).
Here, we explore the chemical composition of GCIRS 22 with the benefit of contemporary line lists and improved physical modelling, including treatment of non-local thermodynamic equilibrium (NLTE) effects. Details of the observations and data reduction are provided in Section 2, followed by details of the analysis in Section 3. In Section 4, we discuss the results and conclude in Section 5.
2 Observations
GCIRS 22 has been observed in the K band using the Near Infrared Spectrometer (NIRSPEC) instrument (McLean 2005; McLean et al. 2007) facility at Keck II under the programme U095 (PI: Rich), as summarized in Table 1. The observations were obtained in the course of a larger programme that has produced data for previous studies (Rich et al. 2017; Thorsbro et al. 2018, 2020, 2023).
We used the 0.432′′ × 12′′ slit and the NIRSPEC-7 filter, which gives a resolving power of R ∼ 23 000. We did not use the adaptive optics system to increase photon counts. The stars were observed with an ABBA scheme with a nod throw of 6′′ along the slit, in order to achieve proper background and dark subtraction. Each exposure integrated for 250 s. Five spectral orders were recorded, covering the wavelength range of 21 000– 24 000 Å. The wavelength coverage is not complete; there are gaps between the orders. The stars were reduced with the NIR-SPEC software redspec (Kim et al. 2015), and thereafter with the Image Reduction and Analysis Facility (IRAF; Tody 1993) to normalize the continuum, eliminate cosmic-ray hits, and correct for telluric lines. The latter was done with a high signal-to-noise spectrum of the rapidly rotating O6.5V star HIP 89584. More details about the data reduction are given in Rich et al. (2017).
Compiled data for GCIRS 22.
3 Analysis
Our analysis of the observed star GCIRS 22 is described in the following subsections. First, we derive the stellar parameters of effective temperature, surface gravity, and microturbulence. This is followed by the line lists used for the spectral analysis and determination of metallicity and abundances. Finally, we employ a Bayesian method grounded in isochrone models to validate the results.
3.1 Effective temperature, Teff
The effective temperature, Teff, of GCIRS 22 has been determined in previous studies: 3550 ± 300 K by Ramírez et al. (2000), 3710 ± 140 K by Blum et al. (2003), 3750 ± 150 K by Cunha et al. (2007), 3053 K by Ting et al. (2019), and 3271 ± 4.7 K from the the Apache Point Observatory Galactic Evolution Experiment (APOGEE) Data Release 17 (DR17) survey (Abdurro’uf et al. 2022). In the studies by Ramírez et al. (2000), Blum et al. (2003) and Cunha et al. (2007) the temperatures were determined using the equivalent width of the CO bandhead near 2.3 µm. Ting et al. (2019) used a neural network machine learning tool called The Payne. They note that the error is on the order of 1%, i.e. ±30 K; however, for cool giants like GCIRS 22, they also note that The Payne appears to be systemically ∼200 K lower than comparable photometric surveys. In general we choose not to list uncertainties from The Payne and APOGEE data as they do not include a treatment of propagated uncertainties; this leads them to have lower values that are not comparable to the other studies.
We employed the method developed by Thorsbro et al. (2020) to derive Teff using the high temperature sensitivity of the scandium lines arising from the 3d24s to 3d4s4p transition (Thorsbro et al. 2018; Thorsbro 2020). The effective temperature determined using this method is 3350 ± 150 K and is listed in Table 1 together with the results from the other studies.
In cool stars, blending of CN molecular lines has to be carefully accounted for when doing spectral analysis. To ensure that the scandium lines used for the temperature determination are not affected by CN blends, we modelled the spectra and varied the abundances of carbon and nitrogen with ±0.2 dex, to demonstrate that the scandium line features are not affected by CN blends; this is shown in Figure 1. The line lists used in this modelling are the same as those used for our later analysis and are detailed in Section 3.4.
3.2 Surface gravity, log g
We used photometry to estimate the surface gravity. Using the Ks-band magnitude of 7.391 ± 0.024 from the Two Micron All Sky Survey (2MASS) catalogue (Skrutskie et al. 2006), and an extinction correction of AK = 2.107 ± 0.2 derived from the colour excess E(J − Ks) = 3.991 using the relation AK = 0.528 × E(J − Ks) (Nishiyama et al. 2009), the absolute K-band magnitude was computed as Kabs = −9.31 ± 0.20.
We applied a bolometric correction of BCKs = 3.04 ± 0.14 (Levesque et al. 2006) to obtain the bolometric magnitude Mbol = −6.27 ± 0.23. This result is in very good agreement with the result of −6.49 ± 0.42 from Cunha et al. (2007).
GCIRS 22 is located in the near vicinity of the super-massive black hole. Thus, the distance modulus adopted was 14.59 ± 0.01, which corresponds to a distance to the supermassive black hole of 8.275 ± 0.042 kpc (GRAVITY Collaboration 2021). The stellar mass was estimated to be M = 7.7 ± 1.5 M⊙ from comparison with evolutionary tracks (Ekström et al. 2012). With an effective temperature of Teff = 3350 ± 150 K, the surface gravity was calculated using the photometric relation
 (1)
which yields a value of log g = −0.02 ± 0.15. The uncertainty on log g was estimated through standard error propagation from the uncertainties in Teff, Mbol, and M,
(1)
which yields a value of log g = −0.02 ± 0.15. The uncertainty on log g was estimated through standard error propagation from the uncertainties in Teff, Mbol, and M,
![Mathematical equation: ${\sigma _{\log \,g}} = {\left[ {{{\left( {{{{\sigma _M}} \over {\ln 10 \cdot M}}} \right)}^2} + {{\left( {{{4 \cdot {\sigma _{{T_{{\rm{eff}}}}}}} \over {\ln 10 \cdot {T_{{\rm{eff}}}}}}} \right)}^2} + {{\left( {0.4 \cdot {\sigma _{{M_{{\rm{Bol,*}}}}}}} \right)}^2}} \right]^{1/2}}.$](/articles/aa/full_html/2025/12/aa56618-25/aa56618-25-eq2.png) (2)
(2)
In the following, we find that the uncertainty of the surface gravity has a minimal impact on the results obtained for the metallicity and abundances. Note that the difference in Teff between our study and Cunha et al. (2007) translates to about 0.2 dex difference in log g, while the remainder comes from the difference in mass.
We estimate the age of GCIRS 22 to be between 25 and 63 Myr old using the isochrones of Ekström et al. (2012). For this estimate We assume solar metallicity, which is a reasonable assumption as shown in Section 3.6.
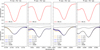 |
Fig. 1 Four fine structure energy level transitions in neutral scandium 3d24s–3d4s4p. The observed spectra of GCIRS 22 are in the top panel. Bottom panel: Model spectra showing the sensitivity of the scandium lines to variations in carbon and nitrogen abundances. This shows that the scandium lines are not affected by blending of CN molecular line features. The sensitivity analysis was based on a model using an effective temperature of 3600 K and solar abundances. We have included a model using an effective temperature of 4500 K to illustrate the temperature sensitivity of the scandium lines, as the lines almost vanish at this temperature due to ionisation. |
3.3 Microturbulence, ξmicro
The microturbulence, ξmicro, which takes into account the small-scale, non-thermal motions in the stellar atmospheres, is important for saturated lines and affects their line strengths. We estimated this parameter using an empirical relation with surface gravity based on a detailed analysis of the spectra of super-giant stars by Taniguchi et al. (2025). Taking the surface gravity uncertainty of 0.15 dex into account, we find ξmicro = 2.53 ± 0.22 km s−1, which is in agreement with Cunha et al. (2007) that finds ξmicro = 2.3 ± 0.1 km s−1. In this study the uncertainty of ξmicro is not a dominant source of uncertainty for the metallicity and abundance determinations as most lines we use are weak lines that are low on the curve of growth.
3.4 Line list
In order to synthesize the spectra, an accurate list of atomic and molecular energy level transitions is required. In the list of atomic energy level transitions, we used the solar centre intensity atlas (Livingston & Wallace 1991) to update wavelengths and line strengths (astrophysical log g f-values) (Thorsbro et al. 2017; Nandakumar et al. 2024).
Because molecular lines are strong features in our spectra, we include molecular lines in the line list. For CN – which is the most dominant molecule apart from CO, whose lines dominate in the 2.3 µm bandhead region – we include the list of Sneden et al. (2014). The CO line data are from Li et al. (2015). At the shorter wavelengths of our spectral region, SiO, H2O, and OH are important. Line lists for these molecules are included in our line list from Langhoff & Bauschlicher (1993), Polyansky et al. (2018) and Brooke et al. (2016), respectively.
To identify clean spectral lines that are suitable for measurement, we examine the synthetic model spectra of cool M giants to identify lines that are not blended with molecular features, in a similar manner to the analysis of the scandium lines described above. We list the lines used for metallicity and abundance determination in Table 2.
3.5 Non-LTE corrections
The spectrum synthesis was carried out without the assumption of LTE. This was achieved by using pre-computed grids of departure coefficients, bi = ni/ni∗, where i denotes some level index for NLTE and LTE populations n and n∗, respectively. We used the departure coefficients to correct the LTE line opacities as described in Section 3 of Piskunov & Valenti (2017).
For magnesium, silicon, and calcium, the grids of departure coefficients are those described in Amarsi et al. (2020). The model atoms come from Amarsi & Asplund (2017) for silicon; and Osorio & Barklem (2016) and Osorio et al. (2019) for magnesium and calcium, albeit with the fine structure collapsed. For iron, the grid of departure coefficients and model atom are those presented in Amarsi et al. (2022).
Lines used for abundance determinations.
3.6 Metallicity
In order to determine metallicities, we synthesized spectra and compared them to the observed spectra. We chose to use the spectral synthesis code Spectroscopy Made Easy (SME, Valenti & Piskunov 2012; Piskunov & Valenti 2017), which interpolates on a grid of one-dimensional (1D) models from the Model Atmospheres with a Radiative and Convective Scheme (MARCS) code (Gustafsson et al. 2008).. These are hydrostatic model atmospheres in spherical geometry, computed assuming LTE, chemical equilibrium, homogeneity, and conservation of the total flux (radiative plus convective, with the convective flux computed using a mixing-length recipe). The SME code has the advantage that it includes a flexible χ2 minimization tool to find the solution that best fits an observed spectrum in a pre-specified spectral window. It also has a powerful continuum normalization routine. In cool star spectra, extra care is needed to normalize the spectrum in the region of a spectral line under consideration.
To determine the metallicity, we used the iron lines listed in Table 2 and fitted them line by line; we obtained a metallicity of −0.08 ± 0.17, with the fits shown in Figure 2. To test the robustness of the fit, we also fitted iron abundances only to the iron lines and the result is −0.12 ± 0.16, i.e. within 0.05. We therefore conclude that the iron lines can be used as a basis for the metallicity fit assuming a solar abundance distribution (Grevesse et al. 2007). We note that our metallicity determination agrees fairly well with previous studies, as shown in Table 1.
We included NLTE effects in the modelling of the iron lines. However, the impact is negligible: repeating the analysis in LTE changes the results by only ∼0.01 dex.
3.7 Abundances
We determined silicon, calcium, and magnesium abundances using the same code and following the same recipe as for determining metallicity, described in Section 3.6. The line by line results for the individual fits are shown in Figure 3.
We find [Si/Fe] to be −0.08 ± 0.20, [Ca/Fe] to be 0.06 ± 0.07, and [Mg/Fe] to be −0.07 ± 0.50. Although the magnesium abundances show significant scatter across individual lines, we find that whether we include them or not in the average alpha-abundance results is inconsequential. We note that more work is needed on the atomic data for the magnesium lines.
We investigated the impact of NLTE effects on the calcium abundance determination. If we do not include NLTE effects in our synthetic spectrum modelling, we find the determined average calcium abundance value to be [Ca/Fe]= 0.40 ± 0.08 dex, i.e. ∼0.3 dex higher.
We used our spectral analysis method on our observed spectrum, assuming the stellar parameters from Cunha et al. (2007), to explore if we can reproduce their calcium abundance value of 0.63 ± 0.1. We find the metallicity to be 0.04 ± 0.15 and [Ca/Fe] to be 0.26 ± 0.06 with NLTE and 0.66 0 ± 06 with LTE. Our analysis very much agrees with the previous work and the spectral analysis of the two studies appears to be of the same quality. The differences between the two studies are thus due to the differences in the stellar parameters, in particular the effective temperature and mass.
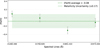 |
Fig. 2 Metallicity determination from individual Fe I Lines. We found the mean [Fe/H] to be −0.08 ± 0.17. |
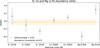 |
Fig. 3 Abundance ratios of [Si/Fe], [Ca/Fe] and [Mg/Fe] from individual lines. The average abundance of alpha elements was found to be −0.03 ± 0.07. Excluding the magnesium, which can be argued for due to the high scatter, yields an average of −0.01 ± 0.09. |
3.8 Validation of results
We performed two validation tests of our results using alternative methods. First, we explored the photometric determination of the mass using Bayesian statistics on isochrone models. Second, we explored the spectroscopic analysis using a grid of model spectra and interpolating in the grid to find a global minimum, both described in the following.
We validated the derived stellar age and mass using the Bayesian framework presented in Kordopatis et al. (2023). This method statistically compares observed stellar parameters against theoretical isochrones while rigorously accounting for measurement uncertainties. The validation process involves projecting observed quantities onto the isochrone grid to compute posterior probability distributions for fundamental parameters, using an age-metallicity prior to constrain the solution space.
For this validation, we employed PARSEC isochrones (Bressan et al. 2012) that span ages from 0.01 to 1 Gyr in 0.01 Gyr increments. The Bayesian projection incorporated three key observables: effective temperature (Teff = 3350 ± 150 K), bolometric magnitude (Mbol = −6.27 ± 0.23), and metallicity ([Fe/H] = −0.08 ± 0.17). Surface gravity (logg) was excluded as it is derivable from Teff and Mbol (Eq. (1)). A flat age-metallicity prior was adopted to avoid introducing external constraints.
In the posterior distributions fitting with the isochrone models, we find Teff = 3349 ± 87 K, Mbol = 6.14 ± 0.40, [Fe/H] = −0.13 ± 0.14, mass = 5.2 ± 0.9 M⊙, log g = −0.17 ± 0.08, and age = 104 ± 30 Myr. The derived atmospheric parameters (Teff, log g, [Fe/H]) and luminosity (Mbol) are mutually consistent. The two isochrone sets yield masses that differ by only ∼1.4 σ, which is not statistically significant and thus within uncertainties. The lower-mass solution implies an age ~60 Myr older; nevertheless, both solutions point to a young, massive star. We therefore regard the isochrone-based fit as an independent validation of our preferred solution.
We also validated the spectroscopic analysis of the abundances using the software Starkit (Kerzendorf & Do 2015; Do et al. 2015). It is a method that takes a grid of model spectra and ‘interpolates’ in the grid to find a model spectrum that is closest to the observed spectrum using the MulitNest algorithm (Feroz & Hobson 2008). To construct the grid, we calculated models using the spectral synthesis code, Spectroscopy Made Easy, described in Section 3.6, with the same line lists and model atmospheres. With this method we find the metallicity to be −0.14 ± 0.15 and the alpha abundances to be 0.16 ± 0.20, and we conclude that the spectroscopic analysis is also robust.
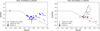 |
Fig. 4 Left panel: silicon over iron abundance ratio versus iron abundance, plotting the value obtained for GCIRS 22 and comparing to literature results for the Milky Way nuclear star cluster (Thorsbro et al. 2020; Ryde et al. 2025). Right panel: calcium over iron abundance. The grey dots are the results from Cunha et al. (2007) with an arrow indicating the changed value for GCIRS 22. The primary reason for the new value of calcium abundance for GCIRS 22 is the taking into account of NLTE effects, and there is thus likely to be a similar reduction of calcium abundance in the remaining set from Cunha et al. (2007). The grey line is an ‘alpha-knee’ model for a simplified Milky Way bulge chemical evolution scenario over-plotted for convenience (Matteucci 2012). |
4 Results and discussion
Our primary aim is to reassess the alpha-element abundances in Galactic Centre (GC) supergiants through contemporary NLTE modelling to clarify the discrepancies observed in previous studies (Cunha et al. 2007; Thorsbro et al. 2020; Ryde et al. 2025). Using updated spectral modelling, improved line lists, and precise stellar parameters derived from scandium line diagnostics, we find near-solar alpha abundances ([Ca/Fe] = 0.06 ± 0.07; [Si/Fe] = –0.08 ± 0.20) for GCIRS 22. This result stands in marked contrast to earlier reports of strong alpha enhancements in GC supergiants, particularly the elevated [Ca/Fe] ratios previously suggested (Cunha et al. 2007).
The notable difference between our study and Cunha et al. (2007) primarily stems from the inclusion of NLTE effects. We find that accounting for NLTE reduces the calcium abundance by approximately 0.3 dex compared to LTE analyses and makes them consistent with theoretical predictions by Amarsi et al. (2020). Figure 4 illustrates this adjustment visually, clearly demonstrating how NLTE modelling more closely aligns our findings to recent studies reporting solar-scaled alpha abundances (Thorsbro et al. 2020; Ryde et al. 2025). It is highly probable that applying similar NLTE corrections to the full Cunha et al. (2007) sample would result in similar reductions and would reshape our understanding of alpha-element enrichment patterns in the GC.
Our findings have significant implications for the chemical evolution scenarios of the Milky Way’s NSC. The solar-scaled alpha abundances we observe suggest that the most recent star formation episodes in the GC, including the formation of super-giants such as GCIRS 22, occurred in an environment already influenced by substantial SN Ia enrichment. Such an enrichment would dilute the alpha-enhanced signature typically produced by rapid core-collapse supernovae. The episodic star formation history in the GC, which is characterized by intermittent bursts followed by extended periods of quiescence, allows sufficient time for SN Ia-driven chemical evolution to dominate the interstellar medium’s alpha-element budget (Nogueras-Lara et al. 2020). Alternatively, one might expect a more solar-like composition of the gas if recent star formation is fuelled by flows of gas from the inner disc, channelled by the bar (Athanassoula 1992; Sormani et al. 2020). Consequently, our derived age for GCIRS 22 (25–63 Myr) aligns well with either scenario, which indicates that its formation from gas already chemically matured through contributions from both SN Ia and SN II.
Moreover, the observed absence of significant alpha enhancement in young supergiants such as GCIRS 22 highlights a distinct chemical signature compared to the metal-rich, alpha-enhanced populations previously identified within the NSC by Thorsbro et al. (2020). Thorsbro et al. (2020) suggest that such alpha-enhanced, metal-rich stars could be either young or old stars. However, we are not able to connect GCIRS 22 to this population, and while we still cannot answer the question, this work would favour an older stellar population (>5 Gyr). This underscores the complexity and heterogeneity of star formation and chemical enrichment processes within the Galactic Centre.
Future investigations that incorporate comprehensive NLTE modelling across larger samples of GC stars are essential to fully explain the chemical evolution of this unique region. Such studies will clarify the interplay between different nucleosynthetic pathways and further refine our understanding of star formation histories in extreme galactic environments.
In summary, our refined analysis clearly indicates solar-scale alpha abundances in recent GC star formation events. This significantly revises previous understandings of chemical enrichment patterns in the Galactic Centre and provides crucial constraints for future modelling of galactic chemical evolution.
5 Conclusions
We present a high-resolution near-infrared spectral analysis of the young red supergiant GCIRS 22 in the Galactic Centre that employs updated atomic data, NLTE corrections, and a refined spectroscopic methodology. Our principal conclusions are:
Solar-scale α-abundances: We derive near-solar [α/Fe] ratios for GCIRS 22 ([Ca/Fe] = 0.06 ± 0.07; [Si/Fe] = −0.08 ± 0.20). This contrasts with earlier reports of strong α enhancements in Galactic Centre supergiants (Cunha et al. 2007) but aligns with recent studies of the nuclear star cluster (Thorsbro et al. 2020; Ryde et al. 2025);
Resolution of historical discrepancies: The 0.57 dex difference in [Ca/Fe] compared to Cunha et al. (2007) is primarily attributed to NLTE effects (accounting for ∼0.34 dex) and differences in stellar parameters (notably Teff and mass). This underscores the critical importance of NLTE modelling and robust parameter determination for cool supergiants;
Implications for GC chemical evolution: the solar [α/Fe] in GCIRS 22 indicates formation from the interstellar medium enriched by both core-collapse supernovae (SNe) and Type Ia SNe. Yet the presence of a population of supergiants in the NSC along with rich clusters of OB stars (e.g. The Arches cluster) suggests that there might be enough SNe to produce significant alpha enrichment; the Fermi bubbles also point to an energetic and possibly SNe powered present. On the other hand, iron enrichment requires >100 Myr timescales, which is consistent with episodic star formation in the Galactic Centre (Nogueras-Lara et al. 2020). The absence of α enhancement in this young supergiant is consistent with the α-enhanced, metal-rich populations in the NSC (Thorsbro et al. 2020) being ancient relics (>5 Gyr) that likely formed during rapid in situ star formation. Given the rich array of current star formation signatures, the earlier era of enrichment may have been witness to a spectacular burst.
Future studies should expand NLTE abundance analyses. They should include larger samples of young supergiants and ancient NSC stars.
Acknowledgements
B.T. acknowledges the financial support from the Wenner-Gren Foundation (WGF2022-0041). S.K. thanks the Observatoire de la Côte d’Azur and the Université Côte d’Azur for making this project possible. RMR acknowledges financial support from his late father Jay Baum Rich. AMA acknowledges support from the Swedish Research Council (VR 2020-03940) and the Crafoord Foundation via the Royal Swedish Academy of Sciences (CR 2024-0015). G.N. acknowledges the support from the Crafoord Foundation via the Royal Swedish Academy of Sciences (Vetenskapsakademiens stiftelser; CR 2024-0034). N.R. acknowledge support from the Swedish Research Council (grant 2023-04744). B.T. and N.R. acknowledge support from the Royal Phys-iographic Society in Lund through the Stiftelsen Walter Gyllenbergs and Märta och Erik Holmbergs donations. The data presented herein were obtained at the W.M. Keck Observatory, which is operated as a scientific partnership among the California Institute of Technology, the University of California and the National Aeronautics and Space Administration. The Observatory was made possible by the generous financial support of the W.M. Keck Foundation. The authors wish to recognize and acknowledge the very significant cultural role and reverence that the summit of Mauna Kea has always had within the indigenous Hawaiian community. We are most fortunate to have the opportunity to conduct observations from this mountain. This publication makes use of data products from the Two Micron All Sky Survey, which is a joint project of the University of Mas-sachusetts and the Infrared Processing and Analysis Center/California Institute of Technology, funded by the National Aeronautics and Space Administration and the National Science Foundation.
References
- Abdurro’uf, Accetta, K., Aerts, C., et al. 2022, ApJS, 259, 35 [NASA ADS] [CrossRef] [Google Scholar]
- Amarsi, A. M., & Asplund, M. 2017, MNRAS, 464, 264 [Google Scholar]
- Amarsi, A. M., Lind, K., Osorio, Y., et al. 2020, A&A, 642, A62 [EDP Sciences] [Google Scholar]
- Amarsi, A. M., Liljegren, S., & Nissen, P. E. 2022, A&A, 668, A68 [NASA ADS] [CrossRef] [EDP Sciences] [Google Scholar]
- Antonini, F., Capuzzo-Dolcetta, R., Mastrobuono-Battisti, A., & Merritt, D. 2012, ApJ, 750, 111 [NASA ADS] [CrossRef] [Google Scholar]
- Arca Sedda, M., Gualandris, A., Do, T., et al. 2020, ApJ, 901, L29 [Google Scholar]
- Athanassoula, E. 1992, MNRAS, 259, 345 [Google Scholar]
- Baba, J., & Kawata, D. 2020, MNRAS, 492, 4500 [NASA ADS] [CrossRef] [Google Scholar]
- Becklin, E. E., & Neugebauer, G. 1975, ApJ, 200, L71 [Google Scholar]
- Bentley, R. O., Do, T., Kerzendorf, W., et al. 2022, ApJ, 925, 77 [Google Scholar]
- Bland-Hawthorn, J., & Gerhard, O. 2016, ARA&A, 54, 529 [Google Scholar]
- Blum, R. D., Sellgren, K., & Depoy, D. L. 1996, AJ, 112, 1988 [Google Scholar]
- Blum, R. D., Ramírez, S. V., Sellgren, K., & Olsen, K. 2003, ApJ, 597, 323 [Google Scholar]
- Bressan, A., Marigo, P., Girardi, L., et al. 2012, MNRAS, 427, 127 [NASA ADS] [CrossRef] [Google Scholar]
- Brooke, J. S. A., Bernath, P. F., Western, C. M., et al. 2016, J. Quant. Spec. Radiat. Transf., 168, 142 [NASA ADS] [CrossRef] [Google Scholar]
- Chen, Z., Do, T., Ghez, A. M., et al. 2023, ApJ, 944, 79 [NASA ADS] [CrossRef] [Google Scholar]
- Cunha, K., Sellgren, K., Smith, V. V., et al. 2007, ApJ, 669, 1011 [NASA ADS] [CrossRef] [Google Scholar]
- Davies, B., Origlia, L., Kudritzki, R.-P., et al. 2009, ApJ, 694, 46 [NASA ADS] [CrossRef] [Google Scholar]
- Do, T., Kerzendorf, W., Winsor, N., et al. 2015, ApJ, 809, 143 [Google Scholar]
- Ekström, S., Georgy, C., Eggenberger, P., et al. 2012, A&A, 537, A146 [Google Scholar]
- Feldmeier-Krause, A., Neumayer, N., Seth, A., et al. 2025, A&A, 696, A213 [NASA ADS] [CrossRef] [EDP Sciences] [Google Scholar]
- Feroz, F., & Hobson, M. P. 2008, MNRAS, 384, 449 [NASA ADS] [CrossRef] [Google Scholar]
- Gallego-Cano, E., Schödel, R., Nogueras-Lara, F., et al. 2020, A&A, 634, A71 [NASA ADS] [CrossRef] [EDP Sciences] [Google Scholar]
- Georgiev, I. Y., Böker, T., Leigh, N., Lützgendorf, N., & Neumayer, N. 2016, MNRAS, 457, 2122 [Google Scholar]
- GRAVITY Collaboration (Abuter, R., et al.) 2021, A&A, 647, A59 [NASA ADS] [CrossRef] [EDP Sciences] [Google Scholar]
- Grevesse, N., Asplund, M., & Sauval, A. J. 2007, Space Sci. Rev., 130, 105 [Google Scholar]
- Guerço, R., Ramírez, S., Cunha, K., et al. 2022a, ApJ, 929, 24 [CrossRef] [Google Scholar]
- Guerço, R., Smith, V. V., Cunha, K., et al. 2022b, MNRAS, 516, 2801 [CrossRef] [Google Scholar]
- Gustafsson, B., Edvardsson, B., Eriksson, K., et al. 2008, A&A, 486, 951 [NASA ADS] [CrossRef] [EDP Sciences] [Google Scholar]
- Hartmann, M., Debattista, V. P., Seth, A., Cappellari, M., & Quinn, T. R. 2011, MNRAS, 418, 2697 [Google Scholar]
- Henshaw, J. D., Barnes, A. T., Battersby, C., et al. 2023, in Astronomical Society of the Pacific Conference Series, 534, Protostars and Planets VII, ed. S. Inutsuka, Y. Aikawa, T. Muto, K. Tomida, & M. Tamura, 83 [Google Scholar]
- Jia, S., Xu, N., Lu, J. R., et al. 2023, ApJ, 949, 18 [NASA ADS] [CrossRef] [Google Scholar]
- Kerzendorf, W., & Do, T. 2015, Starkit: second release, zenodo, doi:10.5281/zenodo.1117920 [Google Scholar]
- Kim, S., Prato, L., & McLean, I. 2015, REDSPEC: NIRSPEC data reduction, Astrophysics Source Code Library [record ascl:1507.017] [Google Scholar]
- Kordopatis, G., Schultheis, M., McMillan, P. J., et al. 2023, A&A, 669, A104 [NASA ADS] [CrossRef] [EDP Sciences] [Google Scholar]
- Kormendy, J., & Ho, L. C. 2013, ARA&A, 51, 511 [Google Scholar]
- Langhoff, S. R., & Bauschlicher, C. W. 1993, Chem. Phys. Letters, 211, 305 [Google Scholar]
- Launhardt, R., Zylka, R., & Mezger, P. G. 2002, A&A, 384, 112 [NASA ADS] [CrossRef] [EDP Sciences] [Google Scholar]
- Levesque, E. M., Massey, P., Olsen, K. A. G., et al. 2006, ApJ, 645, 1102 [NASA ADS] [CrossRef] [Google Scholar]
- Li, G., Gordon, I. E., Rothman, L. S., et al. 2015, ApJS, 216, 15 [NASA ADS] [CrossRef] [Google Scholar]
- Livingston,W., &Wallace, L. 1991, An atlas of the solar spectrum in the infrared from 1850 to 9000 cm−1 (1.1–5.4 micrometer) (NSO Technical Report, Tucson: National Solar Observatory, National Optical Astronomy Observatory, 1991) [Google Scholar]
- Loose, H. H., Kruegel, E., & Tutukov, A. 1982, A&A, 105, 342 [Google Scholar]
- Matsunaga, N., Kawadu, T., Nishiyama, S., et al. 2011, Nature, 477, 188 [Google Scholar]
- Matteucci, F. 2012, Chemical Evolution of Galaxies (Springer-Verlag Berlin Heidelberg) [Google Scholar]
- McLean, I. S. 2005, in High Resolution Infrared Spectroscopy in Astronomy, eds. H.U. Käufl, R. Siebenmorgen, & A.F.M. Moorwood (Springer Berlin, Heidelberg), 25 [Google Scholar]
- McLean, I. S., Prato, L., McGovern, M. R., et al. 2007, ApJ, 658, 1217 [Google Scholar]
- Nandakumar, G., Ryde, N., Forsberg, R., et al. 2024, A&A, 684, A15 [NASA ADS] [CrossRef] [EDP Sciences] [Google Scholar]
- Nandakumar, G., Ryde, N., Schultheis, M., et al. 2025, ApJ, 982, L14 [Google Scholar]
- Nayakshin, S., & Cuadra, J. 2005, A&A, 437, 437 [NASA ADS] [CrossRef] [EDP Sciences] [Google Scholar]
- Neumayer, N., Seth, A., & Böker, T. 2020, A&ARv, 28, 4 [Google Scholar]
- Nishiyama, S., Tamura, M., Hatano, H., et al. 2009, ApJ, 696, 1407 [NASA ADS] [CrossRef] [Google Scholar]
- Nishiyama, S., Schödel, R., Yoshikawa, T., et al. 2016, A&A, 588, A49 [NASA ADS] [CrossRef] [EDP Sciences] [Google Scholar]
- Nishiyama, S., Funamoto, N., & Schödel, R. 2023, ApJ, 951, 148 [NASA ADS] [CrossRef] [Google Scholar]
- Nishiyama, S., Kara, T., Thorsbro, B., et al. 2024, Proc. Japan Acad. Ser. B, 100, 86 [Google Scholar]
- Nogueras-Lara, F., Schödel, R., Gallego-Calvente, A. T., et al. 2020, Nat. Astron., 4, 377 [Google Scholar]
- Nogueras-Lara, F., Schödel, R., & Neumayer, N. 2021, ApJ, 920, 97 [NASA ADS] [CrossRef] [Google Scholar]
- Nogueras-Lara, F., Feldmeier-Krause, A., Schödel, R., et al. 2023, A&A, 680, A75 [NASA ADS] [CrossRef] [EDP Sciences] [Google Scholar]
- Osorio, Y., & Barklem, P. S. 2016, A&A, 586, A120 [NASA ADS] [CrossRef] [EDP Sciences] [Google Scholar]
- Osorio, Y., Lind, K., Barklem, P. S., Allende Prieto, C., & Zatsarinny, O. 2019, A&A, 623, A103 [NASA ADS] [CrossRef] [EDP Sciences] [Google Scholar]
- Piskunov, N., & Valenti, J. A. 2017, A&A, 597, A16 [NASA ADS] [CrossRef] [EDP Sciences] [Google Scholar]
- Polyansky, O. L., Kyuberis, A. A., Zobov, N. F., et al. 2018, MNRAS, 480, 2597 [NASA ADS] [CrossRef] [Google Scholar]
- Ramírez, S. V., Stephens, A. W., Frogel, J. A., & DePoy, D. L. 2000, AJ, 120, 833 [CrossRef] [Google Scholar]
- Rich, R. M., Ryde, N., Thorsbro, B., et al. 2017, AJ, 154, 239 [NASA ADS] [CrossRef] [Google Scholar]
- Ryde, N., Nandakumar, G., Schultheis, M., et al. 2025, ApJ, 979, 174 [Google Scholar]
- Schödel, R., Feldmeier, A., Neumayer, N., Meyer, L., & Yelda, S. 2014, Class. Quant. Grav., 31, 244007 [CrossRef] [Google Scholar]
- Schödel, R., Nogueras-Lara, F., Gallego-Cano, E., et al. 2020, A&A, 641, A102 [Google Scholar]
- Schödel, R., Longmore, S., Henshaw, J., et al. 2023, arXiv e-prints [arXiv:2310.11912] [Google Scholar]
- Skrutskie, M. F., Cutri, R. M., Stiening, R., et al. 2006, AJ, 131, 1163 [NASA ADS] [CrossRef] [Google Scholar]
- Sneden, C., Lucatello, S., Ram, R. S., Brooke, J. S. A., & Bernath, P. 2014, ApJS, 214, 26 [Google Scholar]
- Solanki, S., Ressler, S. M., Murchikova, L., Stone, J. M., & Morris, M. R. 2023, ApJ, 953, 22 [NASA ADS] [CrossRef] [Google Scholar]
- Sormani, M. C., Tress, R. G., Glover, S. C. O., et al. 2020, MNRAS, 497, 5024 [Google Scholar]
- Sormani, M. C., Sanders, J. L., Fritz, T. K., et al. 2022, MNRAS, 512, 1857 [CrossRef] [Google Scholar]
- Taniguchi, D., Matsunaga, N., Kobayashi, N., et al. 2025, A&A, 693, A163 [NASA ADS] [CrossRef] [EDP Sciences] [Google Scholar]
- Thorsbro, B. 2020, Atoms, 8, 4 [Google Scholar]
- Thorsbro, B., Ryde, N., Rich, R. M., et al. 2017, Proc. Int. Astron. Union, 13, 372–373 [Google Scholar]
- Thorsbro, B., Ryde, N., Schultheis, M., et al. 2018, ApJ, 866, 52 [NASA ADS] [CrossRef] [Google Scholar]
- Thorsbro, B., Ryde, N., Rich, R. M., et al. 2020, ApJ, 894, 26 [NASA ADS] [CrossRef] [Google Scholar]
- Thorsbro, B., Forsberg, R., Kordopatis, G., et al. 2023, ApJ, 958, L18 [Google Scholar]
- Ting, Y.-S., Conroy, C., Rix, H.-W., & Cargile, P. 2019, ApJ, 879, 69 [Google Scholar]
- Tody, D. 1993, in ASP Conf. Ser. 52: Astronomical Data Analysis Software and Systems II, eds. R. J. Hanisch, R.J.V. Brissenden, & J. Barnes, 173 [Google Scholar]
- Tremaine, S. D., Ostriker, J. P., & Spitzer, L.Jr., 1975, ApJ, 196, 407 [NASA ADS] [CrossRef] [Google Scholar]
- Tsatsi, A., Mastrobuono-Battisti, A., van de Ven, G., et al. 2017, MNRAS, 464, 3720 [Google Scholar]
- Valenti, J. A., & Piskunov, N. 2012, SME: Spectroscopy Made Easy, astrophysics Source Code Library [record ascl:1202.013] [Google Scholar]
Named ‘InfraRed Source’ (IRS) by Becklin & Neugebauer (1975). Because SIMBAD now adopts the ‘GCIRS’ prefix we follow that convention here.
All Tables
All Figures
|
Fig. 1 Four fine structure energy level transitions in neutral scandium 3d24s–3d4s4p. The observed spectra of GCIRS 22 are in the top panel. Bottom panel: Model spectra showing the sensitivity of the scandium lines to variations in carbon and nitrogen abundances. This shows that the scandium lines are not affected by blending of CN molecular line features. The sensitivity analysis was based on a model using an effective temperature of 3600 K and solar abundances. We have included a model using an effective temperature of 4500 K to illustrate the temperature sensitivity of the scandium lines, as the lines almost vanish at this temperature due to ionisation. |
| In the text | |
|
Fig. 2 Metallicity determination from individual Fe I Lines. We found the mean [Fe/H] to be −0.08 ± 0.17. |
| In the text | |
|
Fig. 3 Abundance ratios of [Si/Fe], [Ca/Fe] and [Mg/Fe] from individual lines. The average abundance of alpha elements was found to be −0.03 ± 0.07. Excluding the magnesium, which can be argued for due to the high scatter, yields an average of −0.01 ± 0.09. |
| In the text | |
|
Fig. 4 Left panel: silicon over iron abundance ratio versus iron abundance, plotting the value obtained for GCIRS 22 and comparing to literature results for the Milky Way nuclear star cluster (Thorsbro et al. 2020; Ryde et al. 2025). Right panel: calcium over iron abundance. The grey dots are the results from Cunha et al. (2007) with an arrow indicating the changed value for GCIRS 22. The primary reason for the new value of calcium abundance for GCIRS 22 is the taking into account of NLTE effects, and there is thus likely to be a similar reduction of calcium abundance in the remaining set from Cunha et al. (2007). The grey line is an ‘alpha-knee’ model for a simplified Milky Way bulge chemical evolution scenario over-plotted for convenience (Matteucci 2012). |
| In the text | |
Current usage metrics show cumulative count of Article Views (full-text article views including HTML views, PDF and ePub downloads, according to the available data) and Abstracts Views on Vision4Press platform.
Data correspond to usage on the plateform after 2015. The current usage metrics is available 48-96 hours after online publication and is updated daily on week days.
Initial download of the metrics may take a while.