Fig. 10.
Download original image
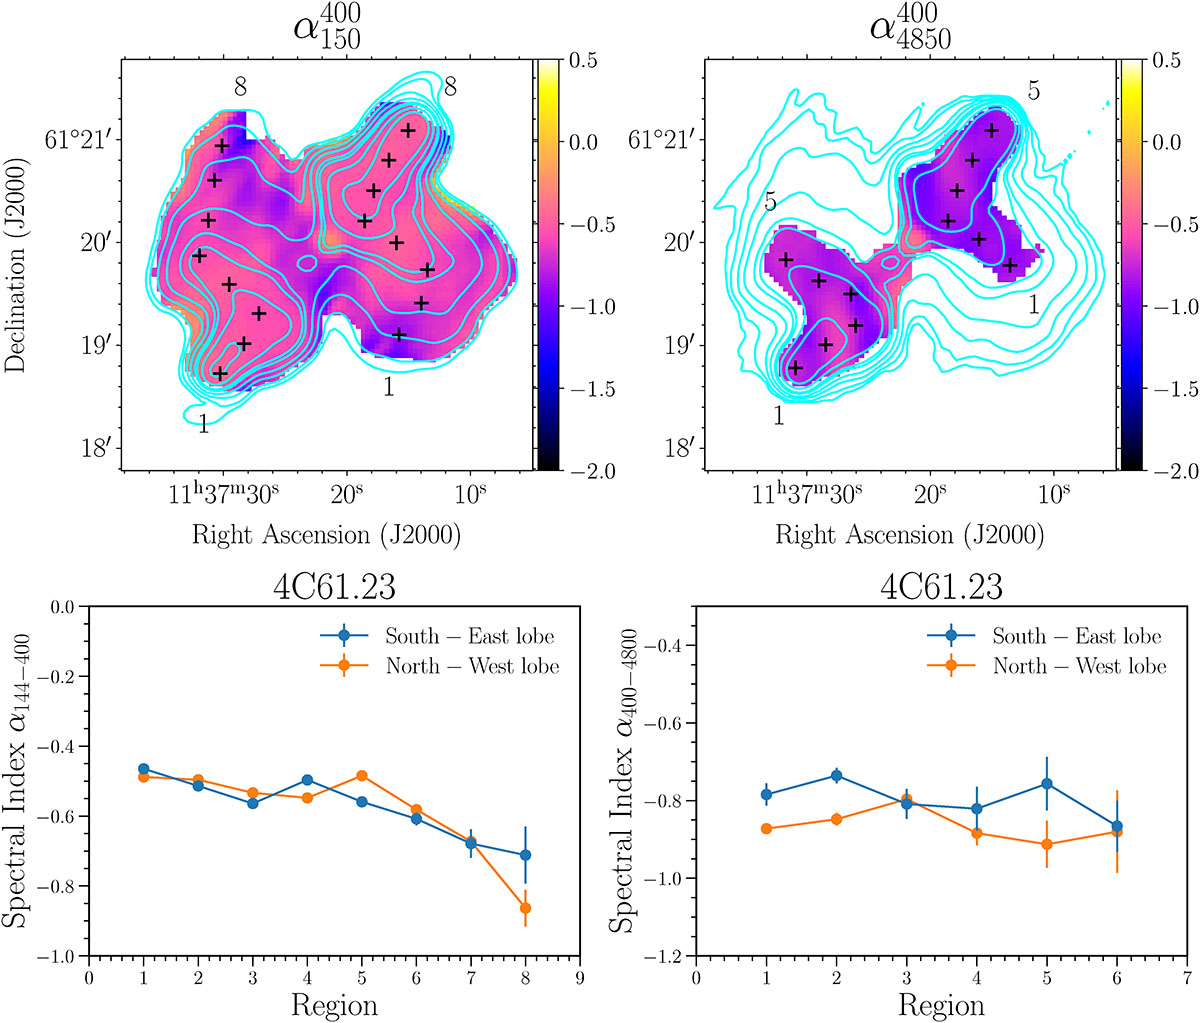
Top row: Same as top row in Fig. 9, but for 4C61.23 using 4850 MHz instead of 3000 MHz as the highest frequency radio-map. The resolution of the maps is 11.1″ × 11.1″. The spectral index between 144−400 MHz map is displayed in the left, while the 400−4850 MHz map is shown in the right. Bottom row: Same as bottom row of Fig. 9, but for 4C61.23. The primary lobe to wing transition line is calculated along the south-east and north-west directions using the spectral index maps. The box size used is 6 × 6 pixels (1.5 times the beam size) to compute the flux densities. The first and last boxes are labeled in the spectral maps, with the positions of all boxes additionally displayed in the maps.
Current usage metrics show cumulative count of Article Views (full-text article views including HTML views, PDF and ePub downloads, according to the available data) and Abstracts Views on Vision4Press platform.
Data correspond to usage on the plateform after 2015. The current usage metrics is available 48-96 hours after online publication and is updated daily on week days.
Initial download of the metrics may take a while.