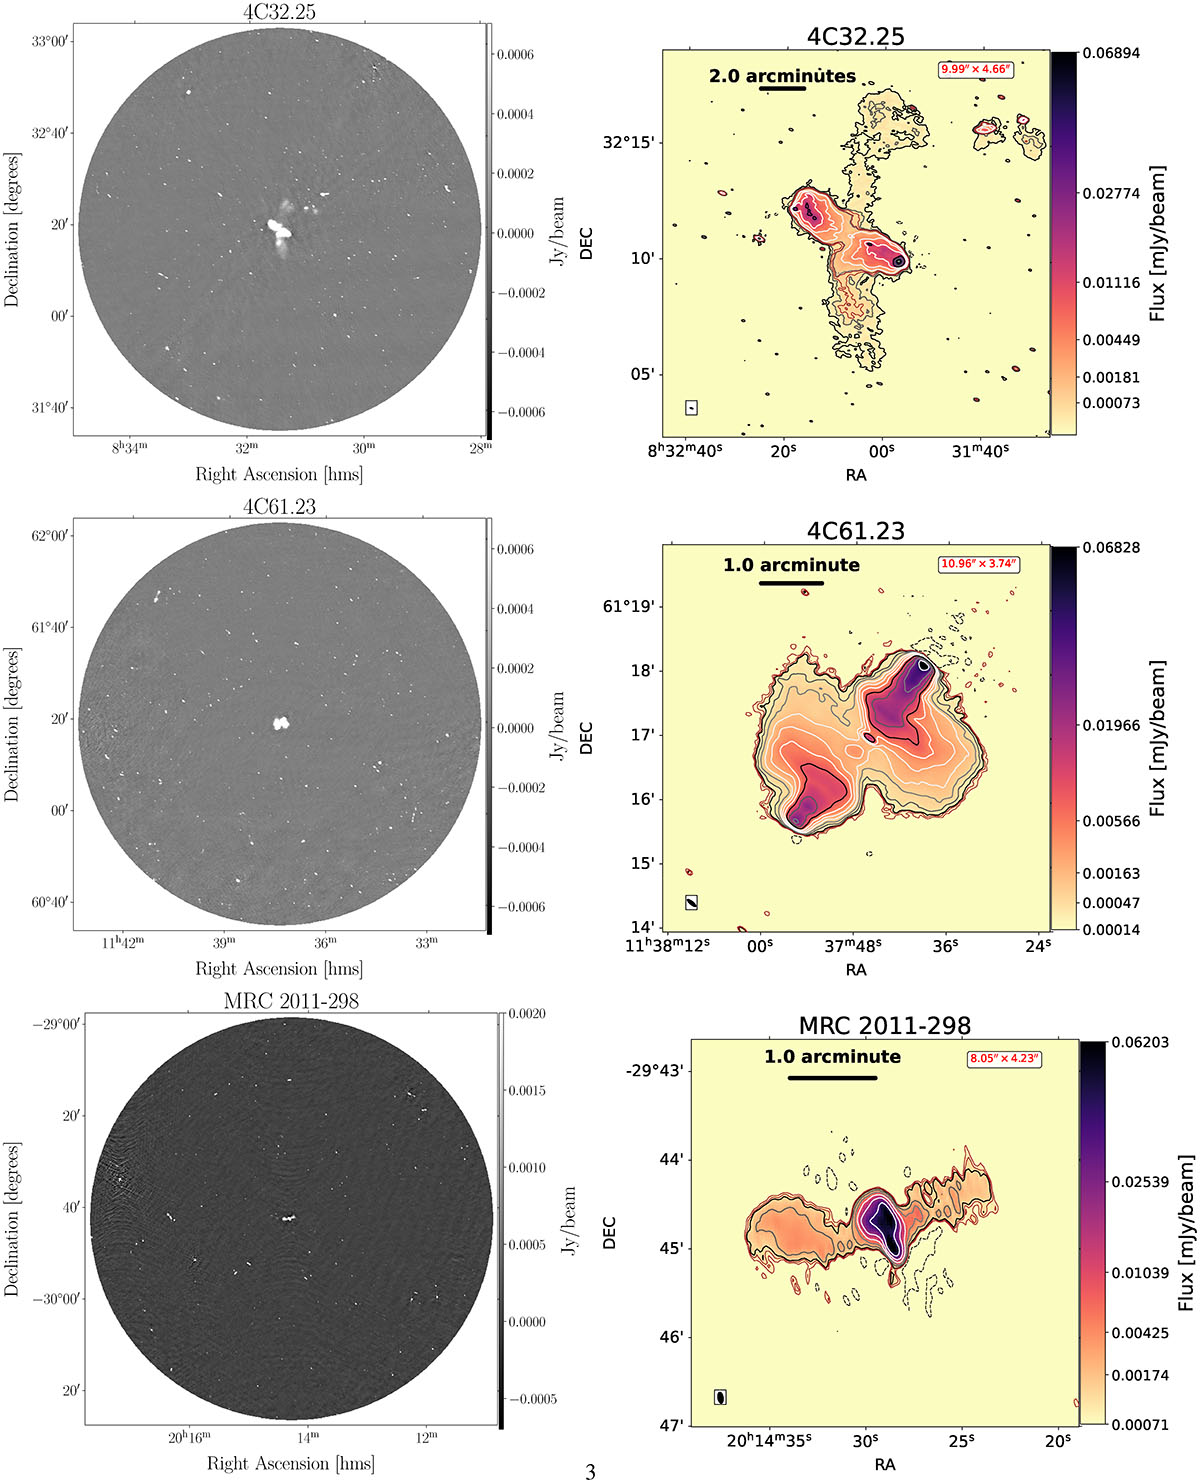
Fig. 6.
Download original image
Right: 400 MHz uGMRT mosaics of the 4C32.25, 4C61.23, and MRC 2011–298 fields. The area of each mosaic is approximately 1.72 deg2. The details of each field are summarized in Table 2. Left: Full-resolution uGMRT 400 MHz band-3 images of the three XRGs 4C32.25, 4C61.23, and MRC 2011–298. The contour levels are (1, 2, 4, 8, …)×3σ mJy/beam, where σ is the local noise level. The −3σ contours are denoted by dashed lines. The restoring beam is indicated by an ellipse in the bottom left corner. The black line indicates the corresponding angular scale.
Current usage metrics show cumulative count of Article Views (full-text article views including HTML views, PDF and ePub downloads, according to the available data) and Abstracts Views on Vision4Press platform.
Data correspond to usage on the plateform after 2015. The current usage metrics is available 48-96 hours after online publication and is updated daily on week days.
Initial download of the metrics may take a while.