Fig. 7.
Download original image
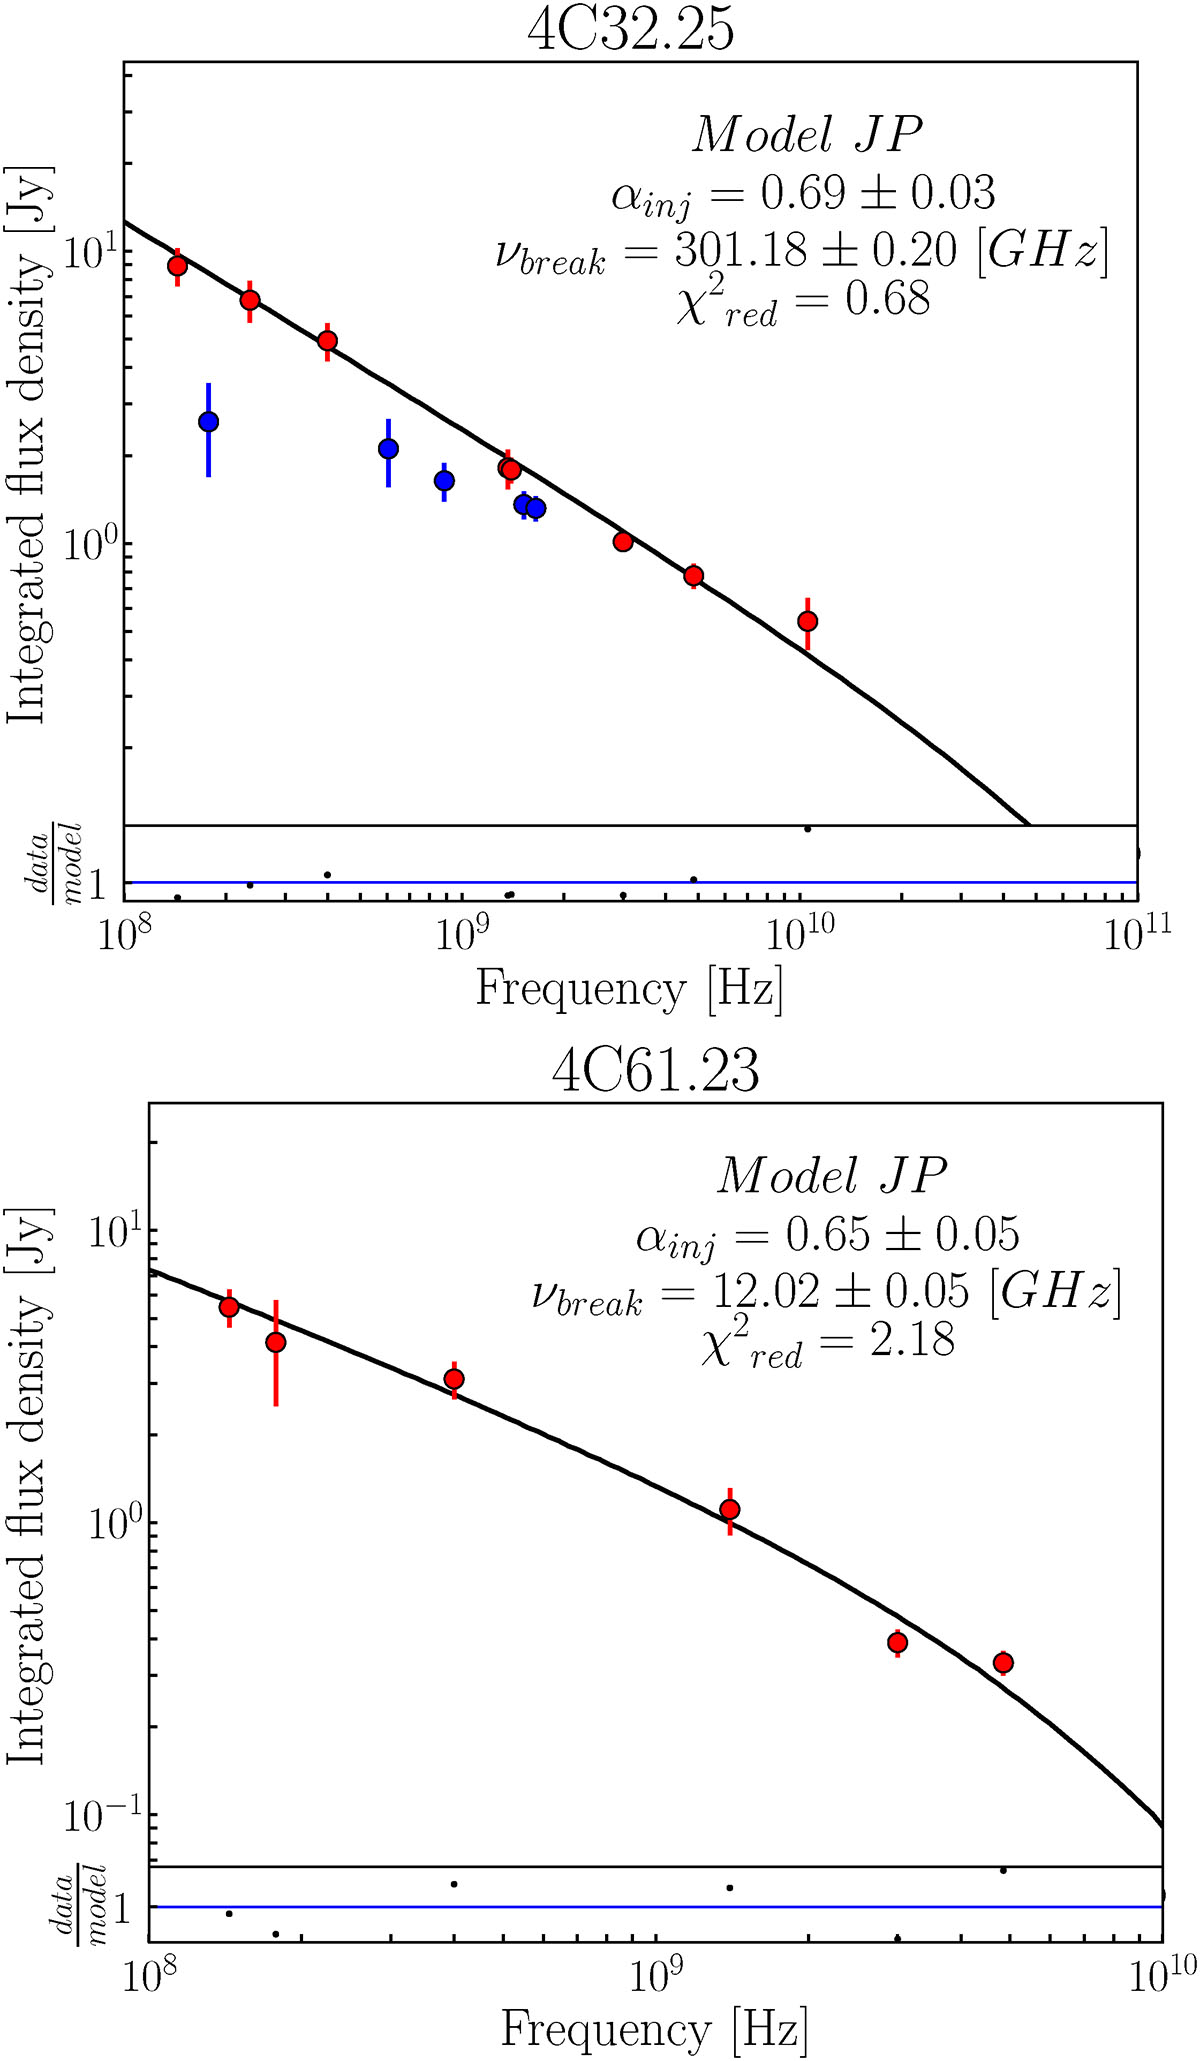
Integrated radio spectra of 4C32.25 and 4C61.23. The flux densities are taken from the reduced datasets and the literature. The solid black line is the fit JP model. Red points are flux densities used in the fitting, while blue points are flux densities excluded from the fitting. The fit parameters and errors are indicated in the legend.
Current usage metrics show cumulative count of Article Views (full-text article views including HTML views, PDF and ePub downloads, according to the available data) and Abstracts Views on Vision4Press platform.
Data correspond to usage on the plateform after 2015. The current usage metrics is available 48-96 hours after online publication and is updated daily on week days.
Initial download of the metrics may take a while.