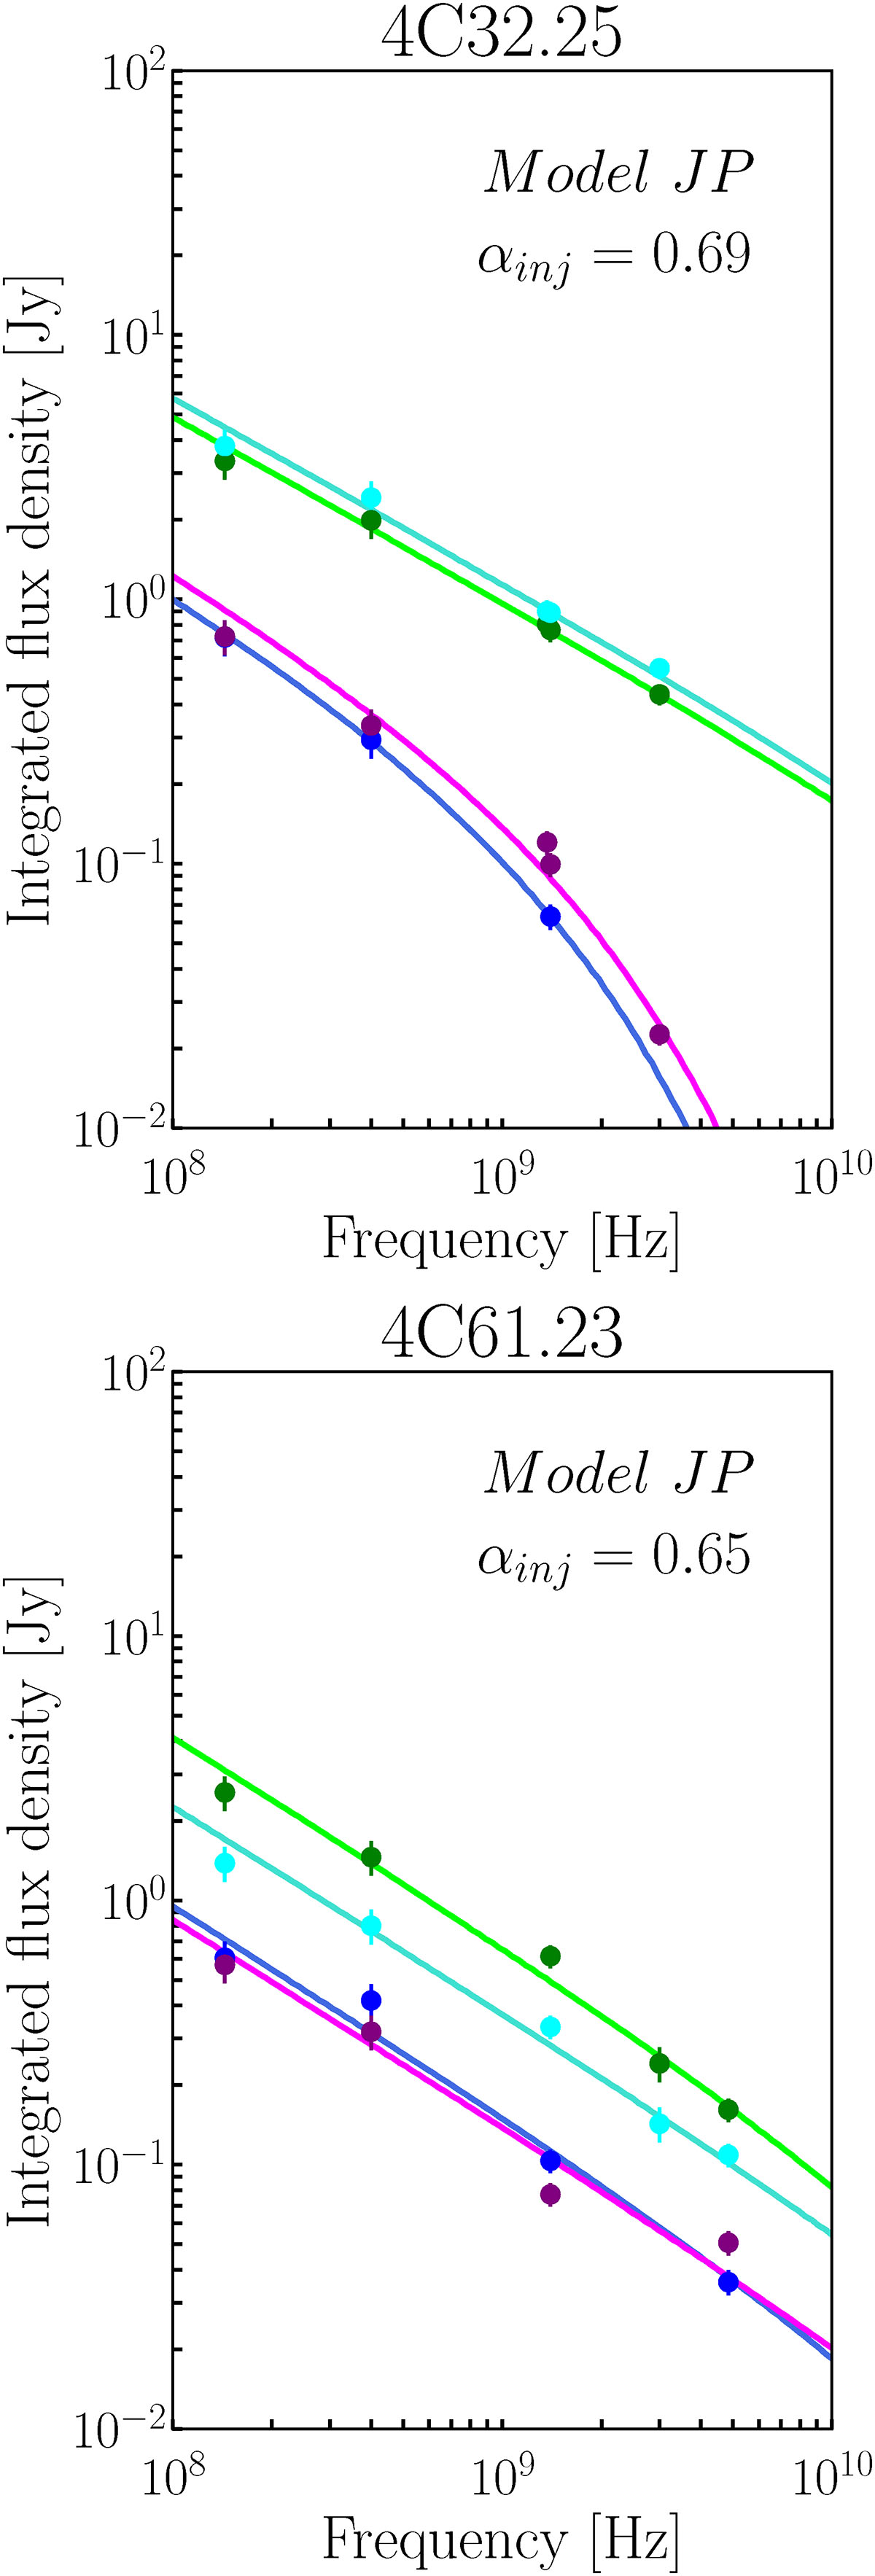
Fig. 8.
Download original image
Integrated radio spectra of the different components (primary lobes and wings) of 4C32.25 and 4C61.23. Colored points indicate the observed flux densities of the primary lobes (green and cyan), and wings (blue and purple). The solid green and cyan lines show the best-fit synchrotron model of the primary lobes, while the blue and purple lines show the best-fit synchrotron models of the wings, respectively. All the models are calculated keeping the injection index, αint fixed to the value indicated.
Current usage metrics show cumulative count of Article Views (full-text article views including HTML views, PDF and ePub downloads, according to the available data) and Abstracts Views on Vision4Press platform.
Data correspond to usage on the plateform after 2015. The current usage metrics is available 48-96 hours after online publication and is updated daily on week days.
Initial download of the metrics may take a while.