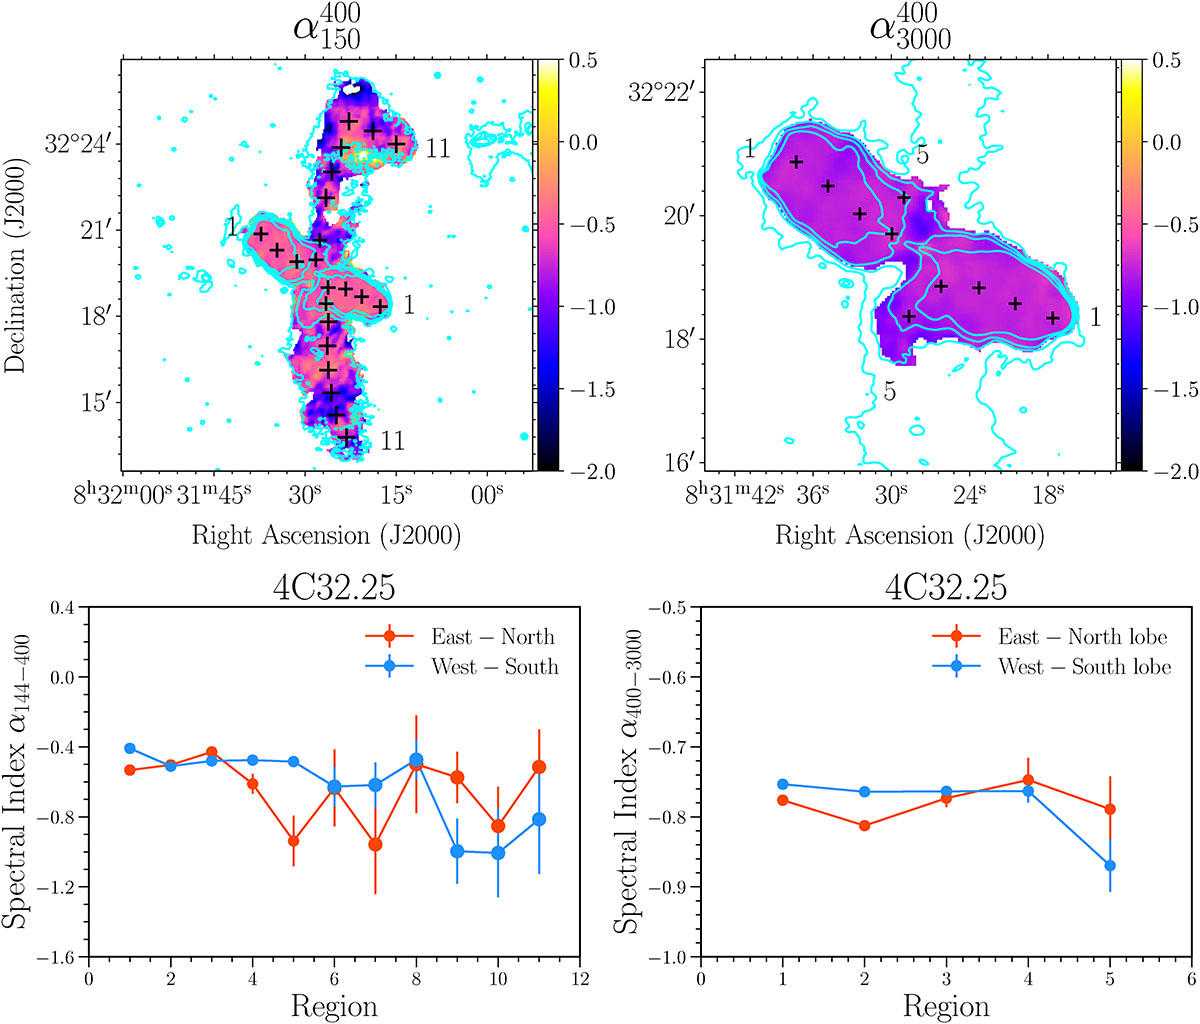
Fig. 9.
Download original image
Top row: Spectral index maps of 4C32.25 between 144−400 MHz (left) and 400−3000 MHz (right). The resolution of the maps is 10.1″ × 10.1″. The spectral index maps are derived using images from LOFAR/uGMRT (left) and uGMRT/VLA (right). The overlaid contour levels are [3, 12, 24, 48]×σrms, where σrms is the local noise from the corresponding lower frequency image. The locations of the centers of the boxes used to calculate the flux densities and corresponding spectral indices are indicated by the marked positions. Larger cross symbols correspond to areas where larger integration boxes were used for flux density estimation. Bottom row: Spectral index profiles of 4C32.25 along the east-north and west-south directions along the primary lobe to wing transition line computed from the spectral maps. The flux densities are calculated using 11 × 11 pixel boxes (2.75 times the beam size) in the primary lobe, and 15 × 15 pixel boxes (3.75 times the beam size) in the wings. In the spectral maps, the first and last boxes are indicated by number, with the locations of all boxes also displayed in the maps. The larger crosses in the 144−400 MHz spectral profiles denote that larger boxes were used to compute the flux densities.
Current usage metrics show cumulative count of Article Views (full-text article views including HTML views, PDF and ePub downloads, according to the available data) and Abstracts Views on Vision4Press platform.
Data correspond to usage on the plateform after 2015. The current usage metrics is available 48-96 hours after online publication and is updated daily on week days.
Initial download of the metrics may take a while.