Fig. 7.
Download original image
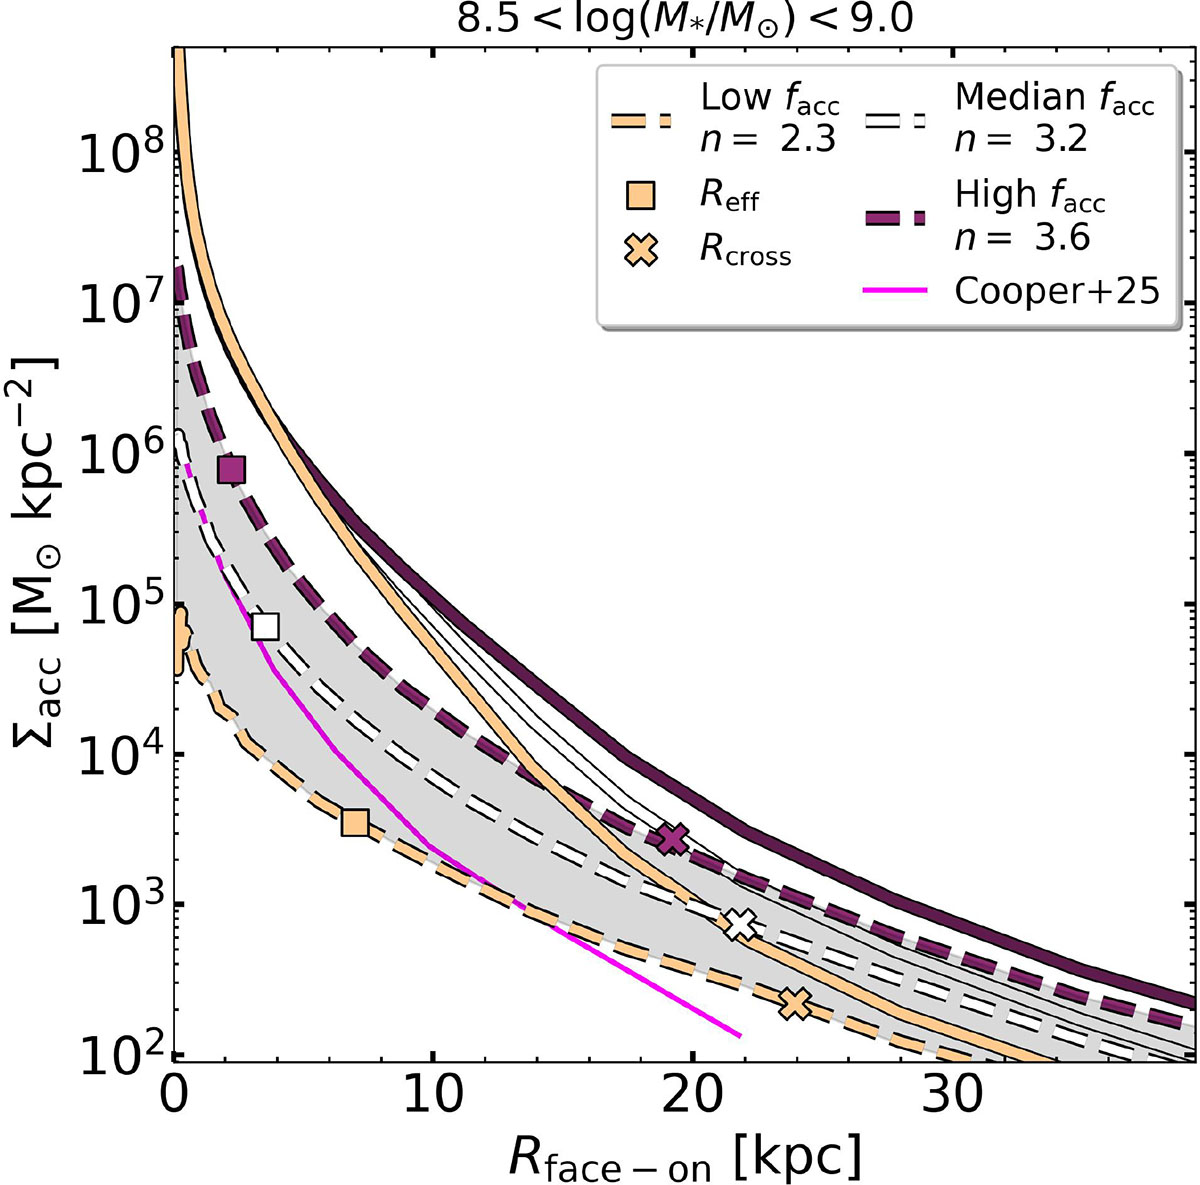
Surface-density profiles of stacked galaxies of stellar mass in 8.5 < log(M*)/M⊙ < 9.0 range. Thick solid lines correspond to the surface stellar-density profile of all stars, dashed lines show the accreted components, and magenta marks the median profile reported by Cooper et al. (2025). Three curves are shown for each. The white ones correspond to the median profile of all galaxies in that M* bin. Beige and purple curves correspond to those with lower than average and higher than average accreted-mass fractions. More precisely, they correspond to those with facc/facc, med < 1/3 and facc/facc, med > 3, respectively. Open squares denote the effective radius of each set; crosses indicate the median value of the projected crossing radius, Rcross, outside which the accreted component dominates over in situ stars. Sérsic-law fit indices, n, are also quoted in the legend. Note that the accreted profiles become more concentrated (i.e. lower Reff, larger n) with increasing facc.
Current usage metrics show cumulative count of Article Views (full-text article views including HTML views, PDF and ePub downloads, according to the available data) and Abstracts Views on Vision4Press platform.
Data correspond to usage on the plateform after 2015. The current usage metrics is available 48-96 hours after online publication and is updated daily on week days.
Initial download of the metrics may take a while.