| Issue |
A&A
Volume 704, December 2025
|
|
|---|---|---|
| Article Number | A57 | |
| Number of page(s) | 9 | |
| Section | Extragalactic astronomy | |
| DOI | https://doi.org/10.1051/0004-6361/202556633 | |
| Published online | 28 November 2025 | |
Accreted stars and stellar haloes of simulated galaxies in TNG50
1
Facultad de Matemática, Astronomía, Física y Computación, UNC, Medina Allende s/n, X5000HUA Córdoba, Argentina
2
Instituto de Astronomía Teórica y Experimental, CONICET–UNC, Laprida 854, X5000BGR Córdoba, Argentina
3
Observatorio Astronómico de Córdoba, UNC, Laprida 854, X5000BGR Córdoba, Argentina
4
Department of Physics and Astronomy, University of Victoria, Victoria, BC V8P 5C2, Canada
⋆ Corresponding author: This email address is being protected from spambots. You need JavaScript enabled to view it.
Received:
28
July
2025
Accepted:
20
October
2025
Abstract
We used the TNG50 cosmological hydrodynamic simulation to study the accreted stellar component and stellar haloes of isolated galaxies spanning a wide range of masses (108 < M*/M⊙ < 1011). We find that stars formed in the main progenitor (i.e. in situ stars) typically dominate the inner regions as far as ∼10 half-light radii from the centre, implying that detecting uncontrovertible evidence for the presence of an accreted stellar halo requires the probing of the far outskirts of a galaxy. Stars from accreted, disrupted satellites (i.e. ex situ stars) dominate beyond that radius (roughly 25% of the virial radius, r200), which we identify as the inner boundary of the outer stellar halo. The fraction of accreted stars decreases monotonically with decreasing galaxy mass, M*, from ∼20% on average in ∼2 × 10¹² M⊙ haloes (M* ∼ 1011 M⊙) to 2–3% in ∼2 × 10¹⁰ M⊙ haloes (M* ∼ 108 M⊙). The outer halo has a mass comparable to roughly 10% of all accreted stars. Fewer than ∼30% of stars in the outer halo are in situ stars, many of which originate from star-forming satellites during the late stages of disruption, especially in low-mass systems. Accreted stars are systematically metal poorer in less massive systems, which makes the outer haloes of dwarf galaxies a fertile hunting ground for extremely metal-poor stars. The density profile of accreted stars can be well approximated by a Sérsic law, whose index, n, and effective radius, Reff, depend strongly on the total accreted mass. At given galaxy mass, the more massive stellar haloes are systematically more concentrated (smaller Reff) and have steeper density profiles (larger n). The accreted component generally has a larger Reff than the main galaxy, although the two can have similar characteristic radii in the most massive systems with the largest accreted fractions. Our results provide a blueprint for interpreting observations of the outskirts of isolated galaxies in terms of their assembly histories.
Key words: galaxies: dwarf / galaxies: formation / galaxies: halos / galaxies: structure
© The Authors 2025
 Open Access article, published by EDP Sciences, under the terms of the Creative Commons Attribution License (https://creativecommons.org/licenses/by/4.0), which permits unrestricted use, distribution, and reproduction in any medium, provided the original work is properly cited.
This article is published in open access under the Subscribe to Open model. This email address is being protected from spambots. You need JavaScript enabled to view it. to support open access publication.
1. Introduction
In the standard Dark Energy plus Cold Dark Matter (ΛCDM) cosmogony, galaxies grow hierarchically through the successive accretion of smaller systems (White & Rees 1978; Frenk et al. 1988; Navarro et al. 1997). Relics of the most massive accretion events (mergers) are observed in the outskirts of massive galaxies, in the form of outer shells of stars (see e.g. Malin & Carter 1980, 1983; Merritt et al. 2016; Monachesi et al. 2016; Rich et al. 2019; Martínez-Delgado et al. 2023). The accretion of smaller galaxies typically lead to tidal disruption rather than mergers, where the accreted stars form tidal tails and streams that, over time, can phase mix to form a featureless spheroidal component (Johnston et al. 1996; Helmi & White 1999; Helmi et al. 2003). The combination of accretion and merger events leads to the formation of a faint stellar envelope known as the stellar halo (e.g. Searle & Zinn 1978; Bullock & Johnston 2005; Abadi et al. 2006).
Significant progress has been made in recent decades in the identification and characterisation of stellar haloes and relics of individual accretion events, not only in Local Group galaxies such as the Milky Way (MW) and M31 (see e.g. Ibata et al. 2014; Helmi et al. 2018; Mateu 2023), but also in nearby MW-like galaxies (see e.g. Merritt et al. 2016; Monachesi et al. 2016; Rich et al. 2019; Martínez-Delgado et al. 2023). Joint analyses of datasets such as those from the APOGEE (Majewski et al. 2017) or GALAH (Buder et al. 2025) surveys and Gaia Collaboration (2018) have revealed hundreds of stellar groups with coherent kinematics and chemical compositions, suggesting that they originate from common progenitors (see e.g. Freeman & Bland-Hawthorn 2002; Belokurov et al. 2018; Koppelman et al. 2019).
Stellar haloes vary significantly from galaxy to galaxy. In the MW, the stellar halo is not particularly prominent and contributes only ∼1% of its total luminosity (Deason et al. 2019), compared with M31, where the halo makes up ∼4% of all stars (McConnachie et al. 2009; Ibata et al. 2014). M31’s stellar halo is also metal richer, with a shallower and more extended mass density profile than the MW’s. These variations suggest that the accretion history of galaxies may differ significantly, even for morphologically similar systems (see e.g. Amorisco 2017; Harmsen et al. 2017; D’Souza & Bell 2018).
Studies of MW-like galaxies outside the Local Group also reveal substantial galaxy-to-galaxy variations in stellar halo properties such as mass fraction, density profile, and age (Merritt et al. 2016; Monachesi et al. 2016), which are likely related to the stochastic nature of galaxy assembly histories (Bullock & Johnston 2005; De Lucia & Helmi 2008; Cooper et al. 2010; Gómez et al. 2012; Proctor et al. 2025). Despite this stochasticity, some broad trends with galaxy stellar mass are expected. Because of the existence of a characteristic mass in the galaxy’s stellar-mass (M*) function (the ‘knee’), the total accreted mass, expressed as a fraction of M*, should increase with M*, especially for systems above the ‘knee’ (see e.g. Purcell et al. 2007). It is less clear, however, what we should expect in the dwarf-galaxy regime. We would like to know if all dwarf galaxies have stellar haloes, or if there is a characteristic galaxy mass below which all stars form in situ and accreted fractions become negligible. Well below the knee, the scatter in the stellar mass–halo mass relation increases due to other baryonic processes, and haloes may not experience mergers with other star-forming progenitors. On the other hand, questions also arise concerning the radial structure of stellar haloes: specifically, whether they are spatially more concentrated or extended than the main galaxy, and if a typical density profile adequately describes all stellar haloes or if they differ widely from system to system (Abadi et al. 2006; Pillepich et al. 2014; Elias et al. 2018; Cooper et al. 2025). We want to find out how far from a galaxy one should probe to reach a region where the accreted component dominates over in situ stars.
Another expected trend with galaxy mass concerns the average metallicity of the halo. Because of the mass-metallicity relation, accreted stellar haloes are expected to be metal poorer than their host galaxies (see e.g. Lee et al. 2006; Kirby et al. 2013). This is certainly true in most well-studied systems, such as the MW, M31, and other MW-like galaxies (see e.g. Tissera et al. 2012; Harmsen et al. 2017; D’Souza & Bell 2018), but it is unclear how these trends extrapolate to the regime of dwarf galaxies, which tend to be metal-poor themselves. In this case, we would like to know how metal-poor haloes are expected to be. Similar questions may be posed regarding the relative age of stars in the main galaxy and its halo. Although it is reasonable to expect that haloes will be older than the galaxy host, it is unclear what to expect when comparing the halo of a dwarf galaxy with that of a MW-like galaxy, or even a more massive system, and which halo is expected to be the oldest.
In this work, we addressed some of these questions using the cosmological hydrodynamical simulation TNG50 (Nelson et al. 2019a; Pillepich et al. 2019). Previous works used Illustris and IllustrisTNG to study accreted mass and stellar haloes, but they have so far focused on massive galaxies (see e.g. Pillepich et al. 2014, 2018a; Rodriguez-Gomez et al. 2016; Elias et al. 2018). These simulations have shown that: (i) the spherically averaged stellar density profile at large galactocentric distances is well approximated by a power law, ρ*(r)∝rα with −7 ≲ α ≲ −2; (ii) steeper halo profiles are associated with galaxies that have undergone early major mergers; and (iii) the stellar halo-mass fraction correlates with assembly time and galaxy morphology, such that galaxies with relatively more massive stellar haloes assemble later and are less rotationally supported.
While these results are broadly consistent1 with observed properties of stellar haloes of massive galaxies (see e.g. Elias et al. 2018), the extension to less massive systems, as discussed above, is yet to be fully understood (Carlin et al. 2019; Deason et al. 2022; Fielder et al. 2024; Tau et al. 2025; Cooper et al. 2025; Gonzalez-Jara et al. 2025) and is one of the main goals of our study. This is important, especially in anticipation of upcoming data from, for example, the LSST (Ivezić et al. 2019), Euclid (Euclid Collaboration: Mellier et al. 2025), and Roman (Akeson et al. 2019) surveys.
This paper is organised as follows. In Section 2, we describe the simulation used and the stellar halo and accreted-mass definition, and we give an illustrative example of a dwarf galaxy. In Section 3, we extend the analysis to the resulting galaxy sample, comparing their accreted and stellar-halo component and different masses at redshift z = 0. We then characterise the spatial distribution of accreted stars and study their metallicities. Finally, in Section 4, we summarise our results and present our conclusions.
2. Numerical methods
2.1. The TNG50 simulation
Our analysis used The Next Generation Illustris simulations (IllustrisTNG2, Marinacci et al. 2018; Naiman et al. 2018; Pillepich et al. 2018b; Springel et al. 2018; Nelson et al. 2019b). This suite of magneto-hydrodynamic cosmological simulations evolve cosmologically representative volumes in a ΛCDM universe with parameters consistent with Planck Collaboration XIII 2016: h = 0.6774; Ωm = 0.3089; σ8 = 0.8159. The initial conditions were set at redshift z = 127 and were obtained with the code N-GENIC (Springel et al. 2005). The simulations were evolved with the moving mesh code AREPO (Springel 2010; Pakmor et al. 2016) forward in time until z = 0. Detailed properties of dark matter and baryonic particles were systematically recorded in 100 snapshots, spaced in time intervals of ∼0.15 Gyr.
In particular, we focused on the TNG50-1 run of the suite (Nelson et al. 2019a; Pillepich et al. 2019, TNG50 hereafter). This simulation is the highest resolution run of a 51.73 Mpc3 periodic box and includes 21603 particles of dark matter, each with a mass of mDM = 4.5 × 10⁵ M⊙, alongside an equivalent number of gas cells, targeting a baryonic mass of mbaryon = 8.5 × 10⁴ M⊙. The Plummer-equivalent gravitational softening length for dark matter and stars was set at ϵDM, * = 0.29 kpc, and for adaptive gas cells a minimum value of ϵgas = 0.07 kpc (both at redshift z = 0).
The TNG50 simulation incorporates a baryonic treatment based on the earlier Illustris project (Vogelsberger et al. 2013, 2014; Weinberger et al. 2017; Pillepich et al. 2018b). In TNG50, gas is allowed to cool down to a temperature of T = 104 K, with cooling and heating rates calculated based on local density, redshift, and metallicity. To prevent artificial fragmentation, gas exceeding a density of n = 0.13 cm−3 was modelled using a two-phase equation of state (Springel & Hernquist 2003). Star formation occurs in gas cells above this density threshold, and stellar particles are born assuming a Chabrier initial mass function (Chabrier 2003), inheriting the cell’s mass, momentum, and metallicity. Their subsequent stellar evolution and feedback implemented following the prescriptions described in Pillepich et al. (2018b), where different stellar populations evolve and return mass and metals to the interstellar medium.
In this simulation, stars enrich their surroundings with elements through stellar winds and supernovae. This happens by injecting metal-rich gas into nearby cells, effectively mixing newly ejected metals from a star particle into the surrounding gas, proportionally reducing the particle mass while its metallicity remains fixed, ensuring that a star particle is never destroyed. In addition, TNG includes gas radiative processes, black-hole formation and evolution, and black-hole feedback in two modes: a thermal mode (activated when the black hole is in a high-accretion-rate state) and a kinetic mode (that occurs when it is in a low-accretion-rate state), as described in Weinberger et al. (2017).
The available group and galaxy catalogues were generated using the friends-of-friends (FoF, Davis et al. 1985) and SUBFIND (Springel et al. 2001; Dolag et al. 2009) algorithms. We used the SubLink (Rodriguez-Gomez et al. 2015) merger trees to track the temporal evolution of galaxies.
2.2. Simulated galaxy sample
Our analysis concentrates solely on isolated galaxies, defined as the central galaxies of their respective FoF groups. We include systems with virial3 masses of log(M200/M⊙) > 10.3, spanning a wide range of galaxy luminosities, from dwarf galaxies to massive systems. This selection implies that our simulated galaxy sample is essentially complete for log(M*/M⊙) > 8.0 (see Section 3.2).
To exclude ongoing merger events and systems clearly out of equilibrium, we filtered out galaxies with a satellite whose stellar mass exceeds 10% that of its host. We also used the merger trees to exclude backsplash systems (i.e. those that were previously associated with a larger group or cluster at some point in their history). For each galaxy, we considered all dark-matter particles, stellar particles, and gas cells gravitationally bound within its virial radius, r200, excluding satellites (defined as stars bound to another SUBFIND sub-halo). All distances and sizes shown throughout this work are in physical distance units.
2.3. In situ versus accreted (ex situ) stars
To characterise the accreted stellar component of a galaxy we first distinguish between stars formed in the main progenitor (i.e. in situ) and accreted star particles contributed by disrupted satellites (i.e. ex situ). Our definition is based on the at-birth distance between a star and the main progenitor of the galaxy (rbirth). Since the simulation outputs are discretised into 100 snapshots, birth distances are measured using the first snapshot after the particle’s birth time, tbirth; i.e. rbirth = |⃗x*(tbirth)−⃗xglx(tbirth)|, where ⃗xglx is the position of the centre of the main progenitor (defined by the most bound particle of the sub-halo) and ⃗x*, the position of a newly born star particle. As an example, Fig. 1 shows, as a function of birth time, rbirth for every star particle bound at z = 0 to TNG50-714463, a dwarf galaxy with log(M*/M⊙) = 8.92 and a virial mass of log(M200/M⊙) = 10.99.
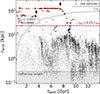 |
Fig. 1. Distance to main progenitor at formation time, rbirth, as function of cosmic formation time, tbirth, for all star particles (black dots) bound to the example galaxy TNG50-714463 (see Fig. 2). Star particles born within the main progenitor (i.e. rbirth < rglx) are classified as in situ; those with rbirth > rglx (above the threshold radius shown as a red horizontal dashed line) are defined as ex situ, or ‘accreted’. The example galaxy accreted two satellites at t ≈ 3.7 Gyr and t ≈ 7.5 Gyr (indicated with black arrows). Stars born in these satellites contribute log(Macc/M⊙) = 7.68 to the host galaxy, for a total accreted-mass fraction of facc = 0.053. Stars in the outer stellar halo at z = 0 (r > rglx, labelled ‘oSH’) are highlighted with empty squares: blue if they are in situ, and red if they are accreted (see Fig. 2). The grey shaded region denotes distances smaller than time-evolving, force-softening length for stars and dark matter, ϵDM, *.
|
Accreted stars are easily identified in this panel; the majority are contributed by two star-forming satellites, one which first crosses the virial radius of the main progenitor (shown by the solid grey curve) at t ∼ 4 Gyr, and another at t ∼ 8 Gyr. The horizontal portion of the tracks are an artefact due to the fact that we can only compute rbirth once a star is in the same FoF group as the main progenitor. For ex situ stars formed before a satellite joins the main progenitor’s FoF, we define rbirth as the distance at that particular time, indicated with downward arrows in the figure.
Based on this figure, we identify as stars that formed outside a fixed fiducial ‘galaxy radius’, which we define as 25% of the virial radius at z = 0 (rglx = 0.25 r200), as ex situ. This choice is of course arbitrary, but we see below that it roughly delineates the boundary of the regions where in situ or ex situ stars dominate at present. In this example, the large majority of stars were formed in situ, with ex situ stars contributing only 5.3% of M*. We also note that the distinction between in situ and ex situ stars is inevitably fuzzy, as satellites may form stars inside and outside rglx as they orbit the main progenitor. In this case, a fraction of stars born in satellites would be classified as in situ (other authors classify these particles as ‘endo-debris’; see e.g. Tissera et al. 2013, 2014; Gonzalez-Jara et al. 2025). In general, these contribute only a small fraction of the total (see e.g. Cooper et al. 2015; Rodriguez-Gomez et al. 2015, for further discussion).
Our choice of a fixed physical radius to define the in situ and ex situ components differs from other choices in the literature, which are typically based on merger trees, where in situ stars are identified with those bound at birth to the main progenitor. This choice can be problematic, as it may designate many stars that form in tightly bound, high-redshift clumps that precede the emergence of the true main progenitor of the system as accreted. At those times, it is difficult to ascertain which of those early clumps is the true main progenitor, and merger trees often choose a main branch that does not coincide with the progenitor where most stars form at the time. Without some kind of correction, merger-tree-based methods might therefore spuriously designate many of those early-forming stars as accreted, although they form in close physical proximity to in situ ones and largely remain confined to the inner regions of the galaxy. Defining accretion using rglx, as we chose to do, facilitates circumvention of such a problem identifying stars formed physically far from the main progenitor as accreted. The choice of a fixed rglx is, although imperfect, simple and effective in this regard.
2.4. Dwarf galaxy stellar halo: An example
As an illustrative example, in Fig. 2 we show the edge-on4 projection of the dwarf galaxy TNG50-714463 shown in Fig. 1. We deliberately chose a low-mass galaxy to highlight individual stars in the stellar halo without overlap.
We decomposed the total stellar component (left panel) by origin: stars born in the main progenitor (in situ, blue, central panel) or accreted (ex situ, red, right panel). Cyan circles indicate rglx = 0.25 r200, which was used as the distance threshold at birth for labelling particles as in situ or ex situ. Star particles found at z = 0 outside rglx are shown with starred symbols and coloured according to their origin. The total accreted stellar mass5 of this galaxy is log(M*, acc/M⊙) = 7.68, which implies an accreted mass fraction of facc = M*, acc/M* ≈ 0.053 and is similar to the median value for galaxies of a similar mass (see Section 3.2). Interestingly, the spatial distribution of the accreted component is misaligned with the disc of the main galaxy and reflects the orbital plane of the accretion event that contributed the majority of accreted stars.
3. Results
3.1. The outer stellar halo
Simulations have revealed that stellar haloes can contain a significant fraction of in situ stars (see e.g. Tissera et al. 2012, 2013; Cooper et al. 2015; Monachesi et al. 2019; Tau et al. 2025; Gonzalez-Jara et al. 2025). Some of these stars may have been pulled into the halo by accretion events or mergers, while others may have been born directly in the halo out of gas instabilities in the circumgalactic medium (see e.g. Ahvazi et al. 2024).
Regardless of their origin, this in situ ‘contamination’ complicates the interpretation of outer stellar envelopes as repositories of mainly accreted mass. Consequently, various authors have explored different choices for the radius beyond which accreted stars dominate, such as multiples of the stellar half-mass radius, a surface-brightness-density limit, or a fixed physical distance at z = 0 (see e.g. D’Souza et al. 2014; Pillepich et al. 2014, 2018a; Monachesi et al. 2016, 2019; Merritt et al. 2016, 2020; Harmsen et al. 2017).
We examine this issue in Fig. 3 for the example galaxy TNG50-714463. This figure shows, as a function of 3D radius, the accreted mass fraction measured in 20 equally spaced logarithmic radial shells. The accreted mass fraction increases with galactocentric distance, from facc < 0.05 within the 3D stellar half-mass radius (r50, *, dashed green line) to facc = 0.5 at r ≈ 15 kpc. Outside this radius, often referred to as the crossing radius (rcross, see Rodriguez-Gomez et al. 2016), the accreted component dominates. The crossing radius definition is quite robust to changes in rglx: the grey shaded region in Fig. 3 shows how the radial profile of the accreted fraction changes when varying rglx by a factor of two. Note that in this case the accreted component only dominates outside rcross ∼ 7 r50, *, a distance greater than typically assumed to define the stellar halo of a galaxy (see e.g. Elias et al. 2018; Monachesi et al. 2019; Tau et al. 2025), and closer to the ‘galaxy radius’ definition adopted here (rglx, dashed blue line).
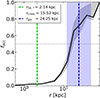 |
Fig. 3. Accreted stellar-mass fraction in 3D radial bins, facc(r) = Macc(r)/M*(r), for the illustrative example galaxy TNG50-714463. The vertical green dashed line indicates the stellar half-mass radius of the galaxy. Accreted stars begin to dominate the stellar mass (facc > 0.5) at r ≳ 15.5 kpc. This defines the ‘crossing radius’, rcross, of the galaxy. This radius is more than seven times larger than the stellar half-mass radius of this galaxy and is smaller than our adopted definition of ‘galaxy radius’, rglx, shown by a dashed blue line. Changes of rglx by a factor of two (blue shaded regions) produce only small variations in the accreted fraction profile (grey shaded regions), with rcross = 15 ± 1 kpc. |
Figure 4 indicates that this is generally true for most galaxies in our TNG50 sample. Here, we show the birth radius (rbirth) versus the present-day galactocentric distance of all star particles in systems within two narrow bins of virial mass: 773 galaxies with 10.4 < log(M200/M⊙) < 10.5 (M* ∼ 108 M⊙, left panel) and 165 galaxies with 11.2 < log(M200/M⊙) < 11.3 (M* ∼ 1010 M⊙, right panel). Regions with large numbers of points, close to the innermost region of galaxies, are shown as filled contours.
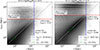 |
Fig. 4. Distance to main progenitor at birth, rbirth, versus galactocentric distance at present time, r, of all star particles (excluding satellites) for 773 galaxies with virial mass of 10.4 < log(M200/M⊙) < 10.5 (left) and 165 galaxies with virial mass of 11.2 < log(M200/M⊙) < 11.3 (right), stacked. The dotted diagonal white line shows the 1:1 relation; i.e. stars at the same galactocentric distance as when they were born. The dashed vertical blue line indicates the median rglx, which separates the main galaxy from the outskirts (the outer stellar halo). Stars born at rbirth > rglx (above the dashed horizontal red line) are classified as accreted. Most in situ stars lie close to the 1:1 line, and most accreted stars end up in the inner regions of the galaxies. Consequently, the mass of stars in the stellar halo is one order of magnitude smaller than the accreted mass fraction. The 25th–75th percentiles of the half-mass stellar radius of the stacks of galaxies are shown with a green interval over the 1:1 line. |
The high density of stellar particles around the 1:1 line represents the bulk of the in situ component and indicates that most in situ stars stay, on average, at distances similar to where they formed. This is not unexpected in isolated galaxies, where stars experience little orbital heating or secular evolution unless perturbed by tidal forces from minor or major mergers (Benítez-Llambay et al. 2016; Navarro et al. 2018; Graus et al. 2019; Mercado et al. 2021).
The size of the in situ-dominated region increases with mass, from ∼10 kpc for the low-mass systems in the left panel of Fig. 4 to ∼30 kpc for the more massive systems in the right panel. Further scrutiny shows that the condition r < rglx describes this region well for galaxies of all masses. This boundary is shown by the vertical dashed blue lines in the same figure, and it is typically of the order of 7–10× the half-mass radius6 of the stars (shown by the green segments on the 1:1 line).
Figure 4 also shows that accreted stars (i.e. those above the red horizontal dashed line) span a wide range of radii at z = 0, with the majority of them well inside rglx. Some in situ stars do spill outside this radius, but they contribute less than 40% of the total. The fraction of stars in each region of this panel is listed in the figure legend.
Finally, we compare the size of the in situ-dominated region (as measured by rcross) with the stellar half-mass radius, r50, *, and the galaxy radius, rglx, as a function of M*, as shown in Fig. 5. The white curves trace the median rcross, which compares well with the average rglx shown by the black curves. The stellar half-mass radius of the galaxy is roughly 7–10× smaller than rcross, implying that only studies of the far outskirts of a galaxy are able to probe primarily accreted stars, with little contamination from in situ stars.
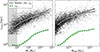 |
Fig. 5. Distance at which accreted stars begin to dominate, rcross, for all galaxies in our sample (black dots) as a function of stellar mass (left panel) and virial mass (right panel). For comparison, we show its median (solid white line), the median stellar half-mass radius, r50, * (dashed green line), and the median stellar half-mass radius of the adopted galaxy radius, rglx (solid black line). The typical galactocentric distance beyond which most stars are accreted is ∼8 times larger than the stellar half-mass radius, and close to the galaxy radius definition, rglx = 0.25 r200. |
We note that the rcross values obtained are robust to the definition of galaxy size (rglx), which we used to define the outer stellar halo and classify accreted stars. For instance, changing the threshold distance for ex situ classification, rglx, by a factor of two only slightly modifies the radius where the accreted component begins to dominate the stellar mass, as the example in Fig. 3 illustrates.
3.2. Accreted-mass fractions
We used the definitions presented in the preceding sections to compute, at z = 0 and for each galaxy in our sample, the total stellar mass of the galaxy, M*, the accreted stellar mass, Macc, the stellar mass in the outer halo, MoSH, and the in situ stellar mass in the outer stellar halo, MoSHi, defined as follows:
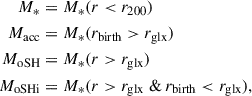 (1)
(1)
where rglx = 0.25 r200 at z = 0, and the definitions exclude stars bound to other sub-haloes of the main halo. Fig. 6 shows these masses for all galaxies as function of virial mass. The M*-M200 relation (solid black line) agrees well with abundance-matching model predictions (see e.g. Moster et al. 2018, shown with a dashed magenta line). However, TNG50 galaxies with M200 < 1011 M⊙ exhibit slightly higher total stellar masses caused by a numerical artefact at the innermost region of galaxies that increases star formation in some dwarf galaxies, as discussed in Celiz et al. (2025). Shaded regions highlight the 25th-75th percentile range of each relation. The starred symbols indicate the TNG50-714463 galaxy used as an illustrative example in Section 2.4.
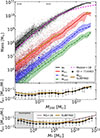 |
Fig. 6. Main panel: Stellar mass (black), accreted mass (red), outer stellar-halo mass (blue) and in-situ mass in the stellar halo (green) as a function of virial mass for the 5131 isolated galaxies (dots) in our sample. Solid lines and shaded regions show the median trend and the 25th-75th percentile regions. The dashed magenta line shows the Moster et al. (2018) abundance-matching relation at z = 0, whereas the solid orange line shows the accreted mass obtained when using publicly available values from a sub-halo membership method, based on SUBFIND. The two black segments at the top indicate the range of mass of the stacks shown in Fig. 4. The middle panel shows the accreted-to-total stellar-mass fraction, facc = Macc/M*, as a function of virial mass, and the bottom panel, facc, as a function of galaxy stellar mass. The incompleteness of the sample at stellar masses of M* < 108 M⊙ generates a spurious upturn in the trend. With a pink line, we show the results reported by Rodriguez-Gomez et al. (2016) for the Illustris simulation. |
Our sample, by definition, contains all central galaxies with 10.3 < log(M200/M⊙) < 12.3 and is complete for stellar masses log(M*/M⊙) > 8.0. The scatter in accreted masses is fairly large, with a 25th-75th percentile range that spans a factor of ∼5 on average. Most of the accreted mass resides inside rglx, as may be seen from the vertical distance between the blue and red curves; typically, the mass in the outer stellar halo makes up only 10% of the total accreted mass. The outer halo also contains some in situ stars, but they typically make up fewer than 30% of all outer-halo stars.
The bottom panels of Fig. 6 show, as a function of either M200 or M*, the accreted-stellar-mass fraction, facc = Macc/M*. At large masses, facc correlates well with halo or galaxy mass, but it seems to converge to a low but constant value of roughly 2% at low masses, with substantial scatter. Note the slight upturn in facc at low M*, which is mainly caused by the fact that our sample is selected with a sharp lower bound in M200, and so it is incomplete and biased for M* < 108 M⊙.
As anticipated when discussing our choice of rglx (Sect. 2.3), our accreted-mass fractions are lower than those obtained using a sub-halo membership criterion7 to classify in situ and ex situ stars. This is shown by the solid orange lines in the bottom panels of Fig. 6. The same panels also show the results reported by Rodriguez-Gomez et al. (2016, ‘RG+16’) that is, for the TNG100 simulation with a solid pink line and both broadly in agreement with our values reported here over the relevant range of masses.
It is not immediately clear why facc converges to ∼2% for M* < 109 M⊙. In particular, it would be interesting to see whether fainter dwarfs actually lack an accreted component altogether. Our analysis cannot rule this out, but it suggests that ‘halo-free’ dwarfs, if present, have stellar masses below 108 M⊙ (see Section 4 of Cooper et al. 2025 for further discussion). Indeed, of the 5131 isolated centrals in our sample, only six galaxies lack accreted stars (Macc = 0), and only 84 do not exhibit a stellar halo (MSH = 0); all have stellar masses of log(M*/M⊙) < 8.5.
3.3. Projected density profile of accreted stars
We next studied the spatial distribution of accreted stars using face-on surface-density profiles stacked in narrow bins of stellar mass. An example is shown in Fig. 7 for galaxies with 8.5 < log M*/M⊙ < 9.0. Here, solid lines show the average stacked profile of all stars, and dashed lines show those of the accreted component.
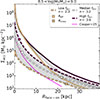 |
Fig. 7. Surface-density profiles of stacked galaxies of stellar mass in 8.5 < log(M*)/M⊙ < 9.0 range. Thick solid lines correspond to the surface stellar-density profile of all stars, dashed lines show the accreted components, and magenta marks the median profile reported by Cooper et al. (2025). Three curves are shown for each. The white ones correspond to the median profile of all galaxies in that M* bin. Beige and purple curves correspond to those with lower than average and higher than average accreted-mass fractions. More precisely, they correspond to those with facc/facc, med < 1/3 and facc/facc, med > 3, respectively. Open squares denote the effective radius of each set; crosses indicate the median value of the projected crossing radius, Rcross, outside which the accreted component dominates over in situ stars. Sérsic-law fit indices, n, are also quoted in the legend. Note that the accreted profiles become more concentrated (i.e. lower Reff, larger n) with increasing facc. |
Three different profiles for each are shown: the median profiles are shown in white, whereas purple and beige profiles correspond, respectively, to systems with unusually high or low accreted-mass fractions. In particular, ‘low facc’ refers to systems whose accreted fractions are below one-third of the median for that M* bin ( ). Analogously, ‘high facc’ denotes systems with
  . Projected half-mass radii of the accreted component (Reff) are marked with filled squares and projected crossing radii (Rcross) with filled crosses.
It is clear from Fig. 7 that accreted-mass profiles become more centrally concentrated as facc increases, which results in smaller values of Reff. As a result, the outermost portions of the accreted-mass profile change less; indeed, at fixed radius the surface density of the high-facc and low-facc systems differs by a factor of ∼4 although the total accreted mass varies by more than one dex. This implies that even galaxies with rather different accreted components may have fairly similar outer stellar haloes.
We fitted these profiles using a Sérsic law (Sérsic 1963) restricted to accreted particles with R ≳ 2 kpc to focus in the outer regions. Sérsic’s law,
![Mathematical equation: $$ \begin{aligned} \Sigma (R) = \Sigma _\mathrm{eff} ~\exp {\left\{ -b_n \left[ \left(\frac{R}{R_{\mathrm{eff} }} \right)^{1/n} -1 \right] \right\} }, \end{aligned} $$](/articles/aa/full_html/2025/12/aa56633-25/aa56633-25-eq4.gif) (2)
(2)
has three fitting parameters, where Reff and Σeff are the effective radius (containing half the stellar mass in projection) and the surface-mass density at that radius, respectively. n is the Sérsic index, and bn follows from the definition of Reff: bn ≈ 2n − 0.324, for n ≳ 1. The n value obtained for each accreted profile is indicated in the legend of the figure.
For comparison, the magenta curve shows the median density profile reported by Cooper et al. (2025) for the same bin of stellar mass. At inner regions, it matches the typical accreted component of TNG50 galaxies (grey shaded region), but exhibits a sharper decline, indicating a less extended accreted component than our results. Thus, our sample of galaxies typically exhibit higher accreted masses than those of Cooper et al. (2025).
We used the fit parameters to illustrate how accreted-mass profiles vary with galaxy and halo mass and  in Fig. 8. There is clearly a large variation in the accreted profiles at a given mass, but median trends still seem robust. The higher the accreted mass fraction (darker colours), the smaller the Reff of the accreted component and, correspondingly, the higher Σeff.
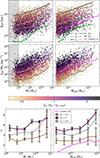 |
Fig. 8. Effective radius, Reff (top panels), and surface density, Σeff (centre panels), of the accreted component of all galaxies in our sample, coloured according to accreted-mass fraction and scaled to the median value at each mass (i.e. |


This result is consistent with the idea that most accreted mass is contributed by just a few systems; the more massive the accreted system, the more resilient it is to tidal forces, and the closer to the centre it gets before being disrupted by the host galaxy (see e.g. White 1982; Dubinski et al. 1996; Naab & Burkert 2003), leading to more concentrated accreted profiles. Indeed, haloes with the most accreted mass typically have density profiles with relatively small Reff, which is comparable to the main galaxy (R50, *, dashed green line) and profile shapes as steep as n ∼ 4, while those with the least accreted mass show Reff as large as the fiducial galaxy size (Rglx = 0.25 R200, solid black line) and shallower profile shapes with n ∼ 2.5.
Our results also compare favourably with those reported by Cooper et al. (2025), despite their rather different numerical approach. The total accreted mass is typically higher in our analysis of TNG50, and, therefore, for similar values of Σeff, the size of the accreted component at fixed mass is typically larger. The accreted component of TNG50 galaxies also extends up to larger galactocentric distances than those reported by Cooper et al. (2025), exhibiting shallower density profiles at large radii; i.e. there is a larger n, as shown in the bottom panels of Fig. 8.
3.4. Stellar-halo metallicities
We see that in situ stars are present throughout the halo, even in the outermost regions of a galaxy. One may ask how distinct accreted stars from in situ stars are. A hint is provided by Fig. 9, which shows the median metallicity [Fe/H] (iron-to-hydrogen abundances, in solar units) of the various stellar components as a function of galaxy and halo mass.
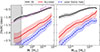 |
Fig. 9. Stellar metallicity [Fe/H] for i) all stars bound to the main galaxy (solid black lines); ii) accreted stars (solid red lines); iii) and outer stellar halo (dashed blue lines), as a function of total stellar mass (left panel) or virial mass (right panel). The dotted magenta line shows the mass-metallicity relation reported by Kirby et al. (2013). Simulated metallicities have been shifted downwards by −0.26 dex to match the Kirby et al. (2013) relation at M* = 109 M⊙. Note the steep mass-metallicity of the accreted component, as well as the fact that outer stellar haloes have a substantial radial metallicity gradient. The outer haloes of dwarf galaxies should be fertile hunting grounds for metal-deficient stars. |
As shown by previous works (see e.g. Benavides et al. 2024; Bian et al. 2025), the median mass-metallicity trend of TNG50 galaxies has to be corrected to agree well with that of Kirby et al. (2013, and this is shown via a dotted magenta line). Here, we show the TNG50 metallicities uniformly rescaled by −0.26 dex to match the Kirby et al. (2013) curve at M* = 109 M⊙.
Interestingly, the trend with mass of the accreted component metallicities is steeper that that of the main galaxies (red curves in Fig. 9), implying that accreted stars in dwarf galaxies are expected to be particularly poor in metal content. This trend is exacerbated when considering only the outer stellar halo (blue curves), which is mainly composed of accreted stars. In other words, the accreted stellar components have a substantial metallicity gradient. This is an intriguing result, as it suggests that some of the most metal poor stars in the Universe may be lurking in the far outskirts of dwarf galaxies (see also Starkenburg et al. 2017 for a similar analysis).
4. Summary and conclusions
We used the TNG50-1 cosmological hydrodynamic simulation to study the accreted stellar components of ∼5000 central galaxies spanning two orders of magnitude in virial mass (10.3 ≤ log(M200/M⊙)≲12.3) and roughly three decades in stellar mass (8 ≲ log(M*/M⊙)≲11). We define stars formed physically far from the main progenitor of a galaxy (rbirth > rglx), where the galaxy radius, rglx, is a fixed physical radius equal to 25% of the virial radius of the system at z = 0, as ‘accreted’.
In agreement with previous work, we find that the total accreted stellar mass correlates strongly with halo virial mass and galaxy mass. In TNG50, the median accreted mass fraction, facc, decreases with decreasing galaxy mass from a peak of nearly 20% at M* ∼ 1011 M⊙ down to facc < 0.02 at M* ∼ 108 M⊙, albeit with large scatter. Essentially all galaxies in the mass range probed by our sample have accreted stars, so stellar haloes are predicted to be a ubiquitous feature of galaxies in this mass range. ‘Halo-free’ galaxies, if they exist, are likely of masses not exceeding M* ∼ 108 M⊙.
The mass in the outer stellar halo, defined as stars found at present at radii beyond rglx, correlates strongly with the accreted mass, but it only contains ∼10% of all accreted stars. Indeed, most accreted stars end up orbiting at small galactocentric distances rather than in the outer halo.
The galaxy radius, rglx, also roughly delineates the regions where the in situ stellar component dominates (r < rglx) from the ‘outer stellar halo’ (r > rglx), where accreted stars dominate. This radius is roughly 7-10 times larger than the half-mass radius of the main galaxy, implying that only studies of the far outskirts of a galaxy are likely to yield relatively pure samples of accreted stars.
At a given mass, the spatial distribution of accreted stars depends strongly on the accreted-mass fraction. The higher the accreted fraction, the more concentrated the accreted component becomes (i.e. smaller Reff and larger values of Sérsic index, n). The effective radius of the accreted component is typically larger than that of the main galaxy, and it can exceed it by up to an order of magnitude.
Our analysis generally confirms these earlier results (see, e.g. Cooper et al. 2013; Pillepich et al. 2014; Amorisco 2017, for works on the MW scale), although some quantitative differences are also found, some of which may be traced to differences in the definitions used to characterize accreted stars. For example, the total accreted mass we report for TNG50 is higher (and the density profiles more concentrated) than those reported by Cooper et al. (2025).
We confirm that accreted stars are typically metal poorer than the main galaxy and that the metallicity of the accreted component scales with galaxy mass. There is also a strong metallicity gradient in the accreted component, so accreted stars in the outer stellar halo are significantly more metal poor than the average accreted star. Our work extends these results to a statistically significant sample of field dwarf galaxies and implies that the outer stellar haloes of dwarf galaxies should be a fertile hunting ground for extremely metal-poor stars.
These results also provide insight into the accreted mass and stellar halo relations for isolated galaxies across a wide range of stellar and virial masses within a cosmological context. This should help with the interpretation of upcoming data from observational projects such as LSST (Ivezić et al. 2019), Roman (Akeson et al. 2019), and Euclid (Euclid Collaboration: Mellier et al. 2025), which will resolve low-surface-brightness regions such as the outskirts of bright nearby dwarfs. This insight will help to connect the faint stellar envelopes surrounding galaxies to their mass assembly history and accreted mass, two key components of the hierarchical structure formation predicted by the ΛCDM cosmology.
See, however, Merritt et al. (2020) for a different view.
Throughout this paper, virial quantities are defined at the radius enclosing 200 times the critical density for closure.
We used the angular momentum of the youngest stars (with ages less than 1 Gyr) to define the z-axis of the projection.
Measured as the sum of the mass of all star particles classified as accreted, within the virial radius.
We also note that the stellar half-mass radius of dwarf galaxies in TNG50 is roughly constant at ∼1 kpc (see e.g. De Almeida et al. 2024; Martin et al. 2025), likely an artefact of limited numerical resolution, as discussed in detail by Celiz et al. (2025).
Available as the AccretedStellarMass_SinceRedshift5 values found in the Merger History public catalogue from the IllustrisTNG webpage: https://www.tng-project.org/data/docs/specifications/#sec5y
Acknowledgments
We thank the referee Andrew Cooper for his insightful comments and a very constructive report of the manuscript. This project has received funding from the European Union’s HORIZON-MSCA-2021-SE-01 Research and Innovation programme under the Marie Sklodowska-Curie grant agreement number 101086388 – Project acronym: LACEGAL. This work was partially supported by the Consejo de Investigaciones Científicas y Técnicas de la República Argentina (CONICET) and the Secretaría de Ciencia y Técnica de la Universidad Nacional de Córdoba (SeCyT). The IllustrisTNG simulations were undertaken with compute time awarded by the Gauss Centre for Supercomputing (GCS) under GCS Large-Scale Projects GCS-ILLU and GCS-DWAR on the GCS share of the supercomputer Hazel Hen at the High Performance Computing Center Stuttgart (HLRS), as well as on the machines of the Max Planck Computing and Data Facility (MPCDF) in Garching, Germany. JFN acknowledges the hospitality of the Max-Planck Institute for Astrophysics, the Donostia International Physics Center, and the Institute for Computational Cosmology at Durham University during the completion of this manuscript.
References
- Abadi, M. G., Navarro, J. F., & Steinmetz, M. 2006, MNRAS, 365, 747 [Google Scholar]
- Ahvazi, N., Sales, L. V., Navarro, J. F., et al. 2024, Open J. Astrophys., 7, 111 [CrossRef] [Google Scholar]
- Akeson, R., Armus, L., Bachelet, E., et al. 2019, arXiv e-prints [arXiv:1902.05569] [Google Scholar]
- Amorisco, N. C. 2017, MNRAS, 469, L48 [Google Scholar]
- Belokurov, V., Erkal, D., Evans, N. W., Koposov, S. E., & Deason, A. J. 2018, MNRAS, 478, 611 [Google Scholar]
- Benavides, J. A., Sales, L. V., Abadi, M. G., et al. 2024, ApJ, 977, 169 [NASA ADS] [CrossRef] [Google Scholar]
- Benítez-Llambay, A. 2017, Py-SPViewer: Cosmological simulations using Smoothed Particle Hydrodynamics, Astrophysics Source Code Library [record ascl:1712.003] [Google Scholar]
- Benítez-Llambay, A., Navarro, J. F., Abadi, M. G., et al. 2016, MNRAS, 456, 1185 [Google Scholar]
- Bian, Y., Du, M., Debattista, V. P., et al. 2025, ApJ, 979, L33 [Google Scholar]
- Buder, S., Kos, J., Wang, X. E., et al. 2025, PASA, 42 [Google Scholar]
- Bullock, J. S., & Johnston, K. V. 2005, ApJ, 635, 931 [Google Scholar]
- Carlin, J. L., Garling, C. T., Peter, A. H. G., et al. 2019, ApJ, 886, 109 [NASA ADS] [CrossRef] [Google Scholar]
- Celiz, B. M., Navarro, J. F., Abadi, M. G., & Springel, V. 2025, A&A, 699, A12 [NASA ADS] [CrossRef] [EDP Sciences] [Google Scholar]
- Chabrier, G. 2003, PASP, 115, 763 [Google Scholar]
- Cooper, A. P., Cole, S., Frenk, C. S., et al. 2010, MNRAS, 406, 744 [Google Scholar]
- Cooper, A. P., D’Souza, R., Kauffmann, G., et al. 2013, MNRAS, 434, 3348 [Google Scholar]
- Cooper, A. P., Parry, O. H., Lowing, B., Cole, S., & Frenk, C. 2015, MNRAS, 454, 3185 [Google Scholar]
- Cooper, A. P., Frenk, C. S., Hellwing, W. A., & Bose, S. 2025, MNRAS, 540, 2049 [Google Scholar]
- Davis, M., Efstathiou, G., Frenk, C. S., & White, S. D. M. 1985, ApJ, 292, 371 [Google Scholar]
- De Almeida, A. P., Mamon, G. A., Dekel, A., & Lima Neto, G. B. 2024, A&A, 687, A131 [Google Scholar]
- De Lucia, G., & Helmi, A. 2008, MNRAS, 391, 14 [NASA ADS] [CrossRef] [Google Scholar]
- Deason, A. J., Belokurov, V., & Sanders, J. L. 2019, MNRAS, 490, 3426 [NASA ADS] [CrossRef] [Google Scholar]
- Deason, A. J., Bose, S., Fattahi, A., et al. 2022, MNRAS, 511, 4044 [NASA ADS] [CrossRef] [Google Scholar]
- Dolag, K., Borgani, S., Murante, G., & Springel, V. 2009, MNRAS, 399, 497 [Google Scholar]
- D’Souza, R., & Bell, E. F. 2018, MNRAS, 474, 5300 [CrossRef] [Google Scholar]
- D’Souza, R., Kauffman, G., Wang, J., & Vegetti, S. 2014, MNRAS, 443, 1433 [Google Scholar]
- Dubinski, J., Mihos, J. C., & Hernquist, L. 1996, ApJ, 462, 576 [NASA ADS] [CrossRef] [Google Scholar]
- Elias, L. M., Sales, L. V., Creasey, P., et al. 2018, MNRAS, 479, 4004 [Google Scholar]
- Euclid Collaboration (Mellier, Y., et al.) 2025, A&A, 697, A1 [Google Scholar]
- Fielder, C., Jones, M. G., Sand, D. J., et al. 2024, AJ, 168, 212 [NASA ADS] [CrossRef] [Google Scholar]
- Freeman, K., & Bland-Hawthorn, J. 2002, ARA&A, 40, 487 [Google Scholar]
- Frenk, C. S., White, S. D. M., Davis, M., & Efstathiou, G. 1988, ApJ, 327, 507 [NASA ADS] [CrossRef] [Google Scholar]
- Gaia Collaboration (Brown, A. G. A., et al.) 2018, A&A, 616, A1 [NASA ADS] [CrossRef] [EDP Sciences] [Google Scholar]
- Gómez, F. A., Coleman-Smith, C. E., O’Shea, B. W., Tumlinson, J., & Wolpert, R. L. 2012, ApJ, 760, 112 [CrossRef] [Google Scholar]
- Gonzalez-Jara, J., Tissera, P. B., Monachesi, A., et al. 2025, A&A, 693, A282 [NASA ADS] [CrossRef] [EDP Sciences] [Google Scholar]
- Graus, A. S., Bullock, J. S., Fitts, A., et al. 2019, MNRAS, 490, 1186 [Google Scholar]
- Harmsen, B., Monachesi, A., Bell, E. F., et al. 2017, MNRAS, 466, 1491 [Google Scholar]
- Helmi, A., & White, S. D. M. 1999, MNRAS, 307, 495 [CrossRef] [Google Scholar]
- Helmi, A., White, S. D. M., & Springel, V. 2003, MNRAS, 339, 834 [NASA ADS] [CrossRef] [Google Scholar]
- Helmi, A., Babusiaux, C., Koppelman, H. H., et al. 2018, Nature, 563, 85 [Google Scholar]
- Ibata, R. A., Lewis, G. F., McConnachie, A. W., et al. 2014, ApJ, 780, 128 [Google Scholar]
- Ivezić, Ž., Kahn, S. M., Tyson, J. A., et al. 2019, ApJ, 873, 111 [Google Scholar]
- Johnston, K. V., Hernquist, L., & Bolte, M. 1996, ApJ, 465, 278 [NASA ADS] [CrossRef] [Google Scholar]
- Kirby, E. N., Cohen, J. G., Guhathakurta, P., et al. 2013, ApJ, 779, 102 [Google Scholar]
- Koppelman, H. H., Helmi, A., Massari, D., Roelenga, S., & Bastian, U. 2019, A&A, 625, A5 [NASA ADS] [CrossRef] [EDP Sciences] [Google Scholar]
- Lee, H., Skillman, E. D., Cannon, J. M., et al. 2006, ApJ, 647, 970 [NASA ADS] [CrossRef] [Google Scholar]
- Majewski, S. R., Schiavon, R. P., Frinchaboy, P. M., et al. 2017, AJ, 154, 94 [NASA ADS] [CrossRef] [Google Scholar]
- Malin, D. F., & Carter, D. 1980, Nature, 285, 643 [CrossRef] [Google Scholar]
- Malin, D. F., & Carter, D. 1983, ApJ, 274, 534 [Google Scholar]
- Marinacci, F., Vogelsberger, M., Pakmor, R., et al. 2018, MNRAS, 480, 5113 [NASA ADS] [Google Scholar]
- Martin, G., Watkins, A. E., Dubois, Y., et al. 2025, MNRAS, 541, 1831 [Google Scholar]
- Martínez-Delgado, D., Cooper, A. P., Román, J., et al. 2023, A&A, 671, A141 [NASA ADS] [CrossRef] [EDP Sciences] [Google Scholar]
- Mateu, C. 2023, MNRAS, 520, 5225 [Google Scholar]
- McConnachie, A. W., Irwin, M. J., Ibata, R. A., et al. 2009, Nature, 461, 66 [Google Scholar]
- Mercado, F. J., Bullock, J. S., Boylan-Kolchin, M., et al. 2021, MNRAS, 501, 5121 [NASA ADS] [CrossRef] [Google Scholar]
- Merritt, A., van Dokkum, P., Abraham, R., & Zhang, J. 2016, ApJ, 830, 62 [Google Scholar]
- Merritt, A., Pillepich, A., van Dokkum, P., et al. 2020, MNRAS, 495, 4570 [NASA ADS] [CrossRef] [Google Scholar]
- Monachesi, A., Bell, E. F., Radburn-Smith, D. J., et al. 2016, MNRAS, 457, 1419 [Google Scholar]
- Monachesi, A., Gómez, F. A., Grand, R. J. J., et al. 2019, MNRAS, 485, 2589 [NASA ADS] [CrossRef] [Google Scholar]
- Moster, B. P., Naab, T., & White, S. D. M. 2018, MNRAS, 477, 1822 [Google Scholar]
- Naab, T., & Burkert, A. 2003, ApJ, 597, 893 [Google Scholar]
- Naiman, J. P., Pillepich, A., Springel, V., et al. 2018, MNRAS, 477, 1206 [Google Scholar]
- Navarro, J. F., Frenk, C. S., & White, S. D. M. 1997, ApJ, 490, 493 [Google Scholar]
- Navarro, J. F., Yozin, C., Loewen, N., et al. 2018, MNRAS, 476, 3648 [Google Scholar]
- Nelson, D., Pillepich, A., Springel, V., et al. 2019a, MNRAS, 490, 3234 [Google Scholar]
- Nelson, D., Springel, V., Pillepich, A., et al. 2019b, Comput. Astrophys. Cosmol., 6, 2 [Google Scholar]
- Pakmor, R., Springel, V., Bauer, A., et al. 2016, MNRAS, 455, 1134 [Google Scholar]
- Pillepich, A., Vogelsberger, M., Deason, A., et al. 2014, MNRAS, 444, 237 [Google Scholar]
- Pillepich, A., Nelson, D., Hernquist, L., et al. 2018a, MNRAS, 475, 648 [Google Scholar]
- Pillepich, A., Springel, V., Nelson, D., et al. 2018b, MNRAS, 473, 4077 [Google Scholar]
- Pillepich, A., Nelson, D., Springel, V., et al. 2019, MNRAS, 490, 3196 [Google Scholar]
- Planck Collaboration XIII. 2016, A&A, 594, A13 [NASA ADS] [CrossRef] [EDP Sciences] [Google Scholar]
- Proctor, K. L., Ludlow, A. D., Lagos, C. d. P., & Robotham, A. S. G. 2025, MNRAS, 542, 1673 [Google Scholar]
- Purcell, C. W., Bullock, J. S., & Zentner, A. R. 2007, ApJ, 666, 20 [Google Scholar]
- Rich, R. M., Mosenkov, A., Lee-Saunders, H., et al. 2019, MNRAS, 490, 1539 [Google Scholar]
- Rodriguez-Gomez, V., Genel, S., Vogelsberger, M., et al. 2015, MNRAS, 449, 49 [Google Scholar]
- Rodriguez-Gomez, V., Pillepich, A., Sales, L. V., et al. 2016, MNRAS, 458, 2371 [Google Scholar]
- Searle, L., & Zinn, R. 1978, ApJ, 225, 357 [Google Scholar]
- Sérsic, J. L. 1963, Boletin de la Asociacion Argentina de Astronomia La Plata Argentina, 6, 41 [Google Scholar]
- Springel, V. 2010, MNRAS, 401, 791 [Google Scholar]
- Springel, V., & Hernquist, L. 2003, MNRAS, 339, 289 [Google Scholar]
- Springel, V., White, S. D. M., Tormen, G., & Kauffmann, G. 2001, MNRAS, 328, 726 [Google Scholar]
- Springel, V., White, S. D. M., Jenkins, A., et al. 2005, Nature, 435, 629 [Google Scholar]
- Springel, V., Pakmor, R., Pillepich, A., et al. 2018, MNRAS, 475, 676 [Google Scholar]
- Starkenburg, E., Oman, K. A., Navarro, J. F., et al. 2017, MNRAS, 465, 2212 [NASA ADS] [CrossRef] [Google Scholar]
- Tau, E. A., Monachesi, A., Gomez, F. A., et al. 2025, A&A, 699, A93 [NASA ADS] [CrossRef] [EDP Sciences] [Google Scholar]
- Tissera, P. B., White, S. D. M., & Scannapieco, C. 2012, MNRAS, 420, 255 [NASA ADS] [CrossRef] [Google Scholar]
- Tissera, P. B., Scannapieco, C., Beers, T. C., & Carollo, D. 2013, MNRAS, 432, 3391 [NASA ADS] [CrossRef] [Google Scholar]
- Tissera, P. B., Beers, T. C., Carollo, D., & Scannapieco, C. 2014, MNRAS, 439, 3128 [NASA ADS] [CrossRef] [Google Scholar]
- Vogelsberger, M., Genel, S., Sijacki, D., et al. 2013, MNRAS, 436, 3031 [Google Scholar]
- Vogelsberger, M., Genel, S., Springel, V., et al. 2014, Nature, 509, 177 [Google Scholar]
- Weinberger, R., Springel, V., Hernquist, L., et al. 2017, MNRAS, 465, 3291 [Google Scholar]
- White, S. D. M. 1982, Saas-Fee Adv. Course, 12, 291 [Google Scholar]
- White, S. D. M., & Rees, M. J. 1978, MNRAS, 183, 341 [Google Scholar]
All Figures
|
Fig. 1. Distance to main progenitor at formation time, rbirth, as function of cosmic formation time, tbirth, for all star particles (black dots) bound to the example galaxy TNG50-714463 (see Fig. 2). Star particles born within the main progenitor (i.e. rbirth < rglx) are classified as in situ; those with rbirth > rglx (above the threshold radius shown as a red horizontal dashed line) are defined as ex situ, or ‘accreted’. The example galaxy accreted two satellites at t ≈ 3.7 Gyr and t ≈ 7.5 Gyr (indicated with black arrows). Stars born in these satellites contribute log(Macc/M⊙) = 7.68 to the host galaxy, for a total accreted-mass fraction of facc = 0.053. Stars in the outer stellar halo at z = 0 (r > rglx, labelled ‘oSH’) are highlighted with empty squares: blue if they are in situ, and red if they are accreted (see Fig. 2). The grey shaded region denotes distances smaller than time-evolving, force-softening length for stars and dark matter, ϵDM, *.
|
||
| In the text | |||
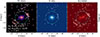 |
Fig. 2. Edge-on projection of simulated dwarf galaxy (TNG50-714463, stellar and virial masses are shown in the legend, left panel), split into its in situ (centre panel) and accreted (right panel) stellar components. Our definition of galaxy radius, rglx = 0.25 r200 = 24.25 kpc, is indicated by the cyan circles, separating the main galaxy from its outer stellar halo. This example has an accreted mass comparable to the median value for galaxies of comparable mass (facc = 0.053). Brighter colours indicate a higher number density of star particles, while starred symbols show outer halo stars coloured according to their origin (blue for in situ; red for accreted). Images generated with PySPHViewer (Benítez-Llambay 2017). |
| In the text | |
|
Fig. 3. Accreted stellar-mass fraction in 3D radial bins, facc(r) = Macc(r)/M*(r), for the illustrative example galaxy TNG50-714463. The vertical green dashed line indicates the stellar half-mass radius of the galaxy. Accreted stars begin to dominate the stellar mass (facc > 0.5) at r ≳ 15.5 kpc. This defines the ‘crossing radius’, rcross, of the galaxy. This radius is more than seven times larger than the stellar half-mass radius of this galaxy and is smaller than our adopted definition of ‘galaxy radius’, rglx, shown by a dashed blue line. Changes of rglx by a factor of two (blue shaded regions) produce only small variations in the accreted fraction profile (grey shaded regions), with rcross = 15 ± 1 kpc. |
| In the text | |
|
Fig. 4. Distance to main progenitor at birth, rbirth, versus galactocentric distance at present time, r, of all star particles (excluding satellites) for 773 galaxies with virial mass of 10.4 < log(M200/M⊙) < 10.5 (left) and 165 galaxies with virial mass of 11.2 < log(M200/M⊙) < 11.3 (right), stacked. The dotted diagonal white line shows the 1:1 relation; i.e. stars at the same galactocentric distance as when they were born. The dashed vertical blue line indicates the median rglx, which separates the main galaxy from the outskirts (the outer stellar halo). Stars born at rbirth > rglx (above the dashed horizontal red line) are classified as accreted. Most in situ stars lie close to the 1:1 line, and most accreted stars end up in the inner regions of the galaxies. Consequently, the mass of stars in the stellar halo is one order of magnitude smaller than the accreted mass fraction. The 25th–75th percentiles of the half-mass stellar radius of the stacks of galaxies are shown with a green interval over the 1:1 line. |
| In the text | |
|
Fig. 5. Distance at which accreted stars begin to dominate, rcross, for all galaxies in our sample (black dots) as a function of stellar mass (left panel) and virial mass (right panel). For comparison, we show its median (solid white line), the median stellar half-mass radius, r50, * (dashed green line), and the median stellar half-mass radius of the adopted galaxy radius, rglx (solid black line). The typical galactocentric distance beyond which most stars are accreted is ∼8 times larger than the stellar half-mass radius, and close to the galaxy radius definition, rglx = 0.25 r200. |
| In the text | |
|
Fig. 6. Main panel: Stellar mass (black), accreted mass (red), outer stellar-halo mass (blue) and in-situ mass in the stellar halo (green) as a function of virial mass for the 5131 isolated galaxies (dots) in our sample. Solid lines and shaded regions show the median trend and the 25th-75th percentile regions. The dashed magenta line shows the Moster et al. (2018) abundance-matching relation at z = 0, whereas the solid orange line shows the accreted mass obtained when using publicly available values from a sub-halo membership method, based on SUBFIND. The two black segments at the top indicate the range of mass of the stacks shown in Fig. 4. The middle panel shows the accreted-to-total stellar-mass fraction, facc = Macc/M*, as a function of virial mass, and the bottom panel, facc, as a function of galaxy stellar mass. The incompleteness of the sample at stellar masses of M* < 108 M⊙ generates a spurious upturn in the trend. With a pink line, we show the results reported by Rodriguez-Gomez et al. (2016) for the Illustris simulation. |
| In the text | |
|
Fig. 7. Surface-density profiles of stacked galaxies of stellar mass in 8.5 < log(M*)/M⊙ < 9.0 range. Thick solid lines correspond to the surface stellar-density profile of all stars, dashed lines show the accreted components, and magenta marks the median profile reported by Cooper et al. (2025). Three curves are shown for each. The white ones correspond to the median profile of all galaxies in that M* bin. Beige and purple curves correspond to those with lower than average and higher than average accreted-mass fractions. More precisely, they correspond to those with facc/facc, med < 1/3 and facc/facc, med > 3, respectively. Open squares denote the effective radius of each set; crosses indicate the median value of the projected crossing radius, Rcross, outside which the accreted component dominates over in situ stars. Sérsic-law fit indices, n, are also quoted in the legend. Note that the accreted profiles become more concentrated (i.e. lower Reff, larger n) with increasing facc. |
| In the text | |
|
Fig. 8. Effective radius, Reff (top panels), and surface density, Σeff (centre panels), of the accreted component of all galaxies in our sample, coloured according to accreted-mass fraction and scaled to the median value at each mass (i.e. |
| In the text | |
|
Fig. 9. Stellar metallicity [Fe/H] for i) all stars bound to the main galaxy (solid black lines); ii) accreted stars (solid red lines); iii) and outer stellar halo (dashed blue lines), as a function of total stellar mass (left panel) or virial mass (right panel). The dotted magenta line shows the mass-metallicity relation reported by Kirby et al. (2013). Simulated metallicities have been shifted downwards by −0.26 dex to match the Kirby et al. (2013) relation at M* = 109 M⊙. Note the steep mass-metallicity of the accreted component, as well as the fact that outer stellar haloes have a substantial radial metallicity gradient. The outer haloes of dwarf galaxies should be fertile hunting grounds for metal-deficient stars. |
| In the text | |
Current usage metrics show cumulative count of Article Views (full-text article views including HTML views, PDF and ePub downloads, according to the available data) and Abstracts Views on Vision4Press platform.
Data correspond to usage on the plateform after 2015. The current usage metrics is available 48-96 hours after online publication and is updated daily on week days.
Initial download of the metrics may take a while.