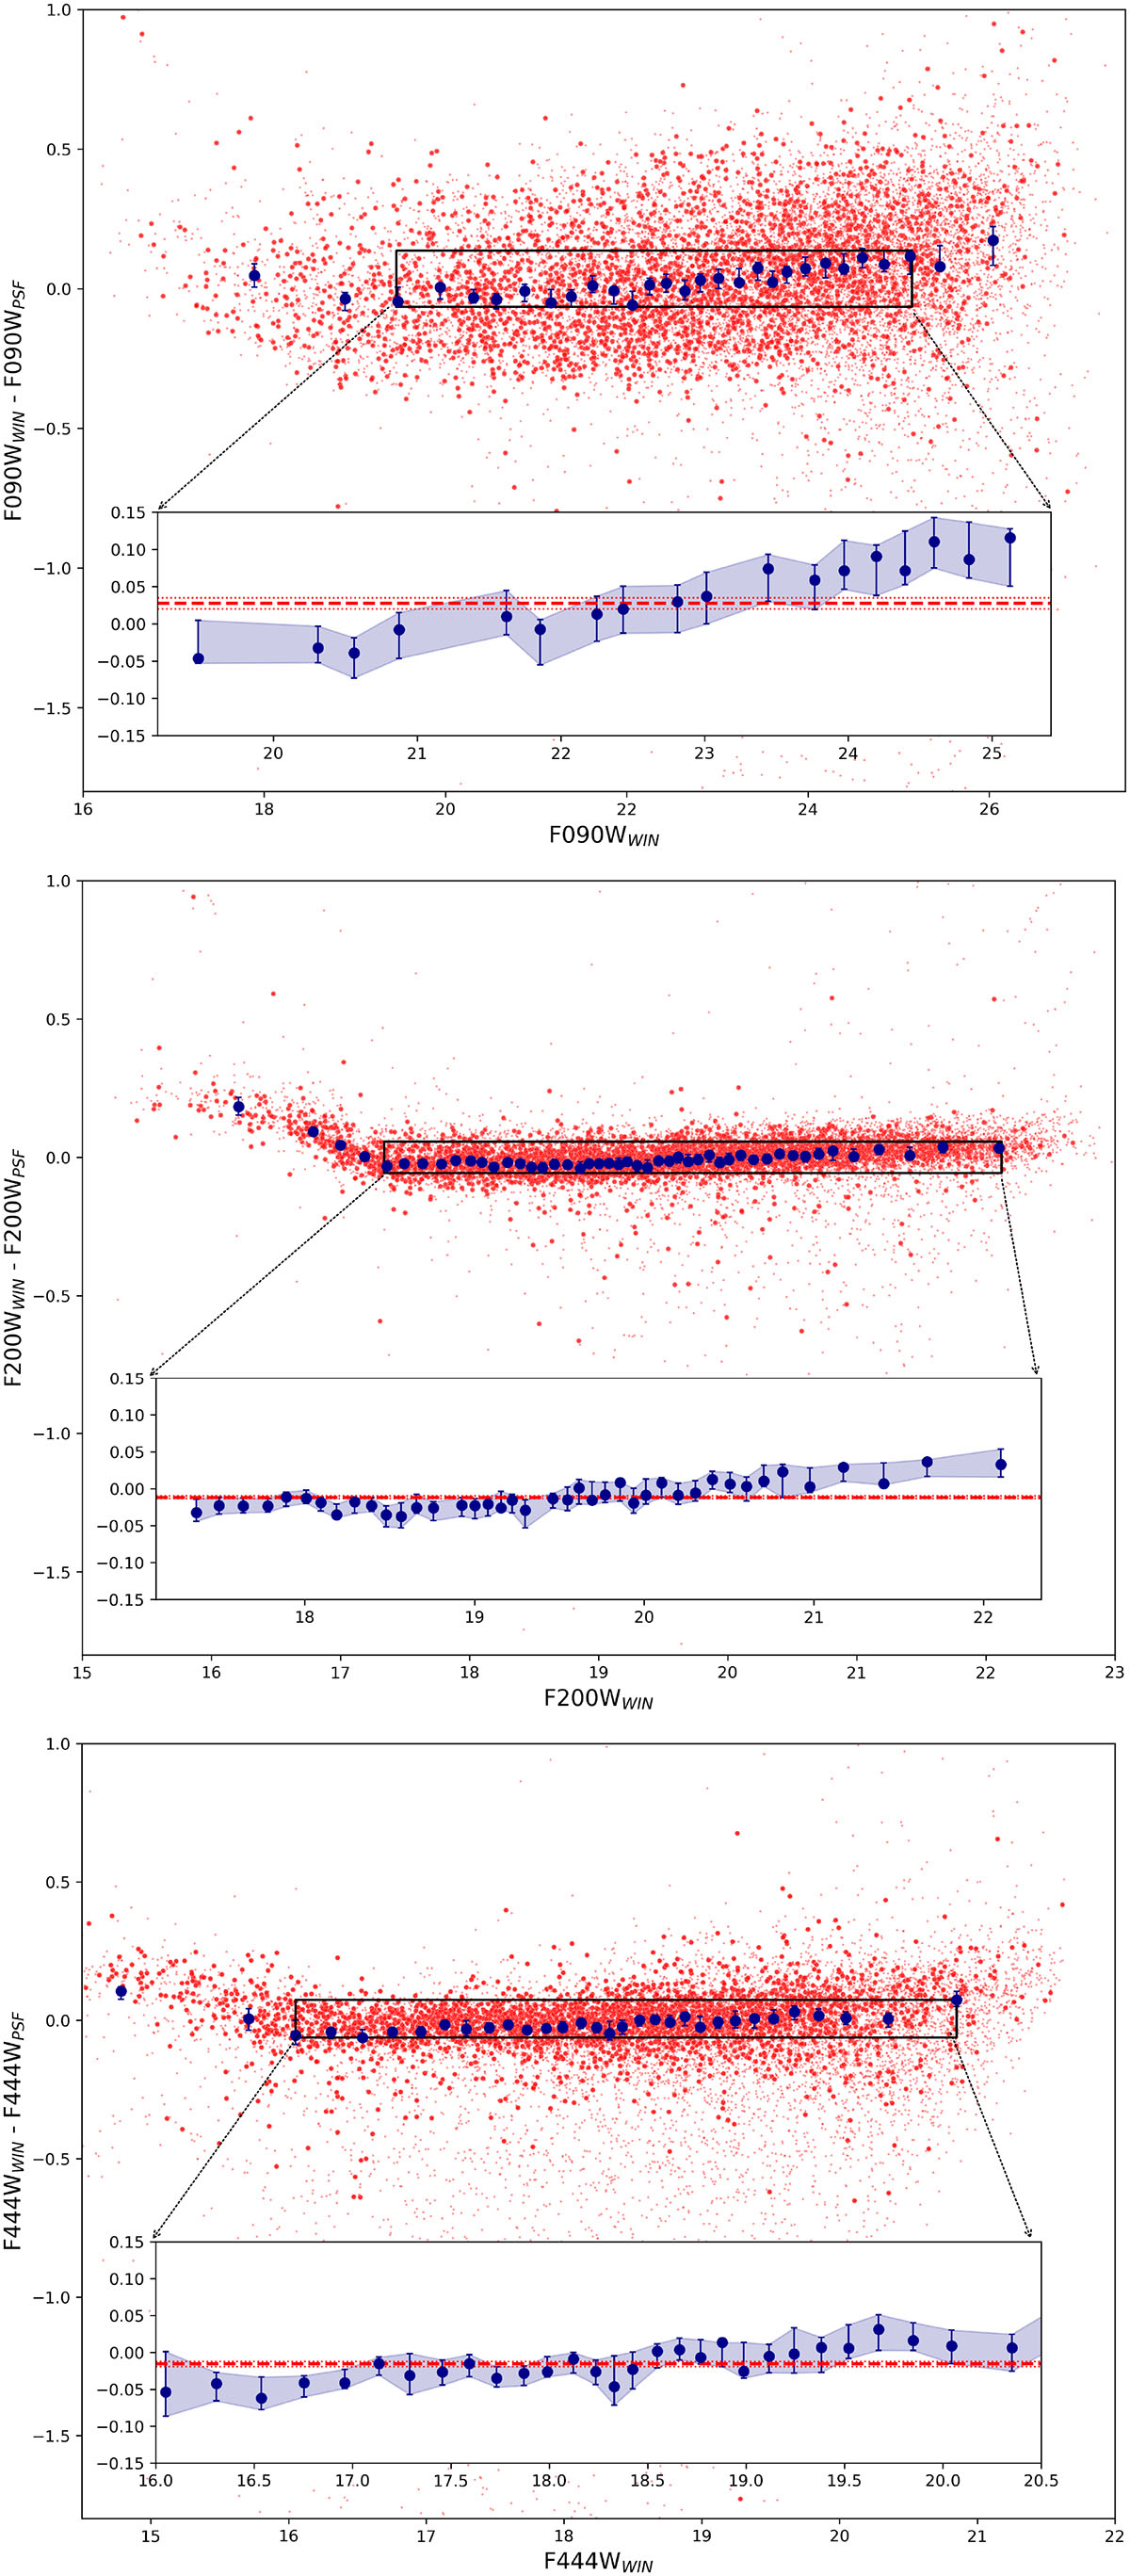
Fig. 1.
Download original image
Photometric calibration for the F090W (top), F200W (middle), and F444W (bottom) bands. Matched sources are shown as faint red dots. The subset of point-like sources (eccentricity < 0.01) used for calibration is indicated by red circles. Blue circles with error bars represent bin-averaged values computed via the bin-scatter method. The lower inset zooms into the region used for regression, delimited by dashed lines. Horizontal dashed lines indicate the linear fits used to compute the final magnitude offsets.
Current usage metrics show cumulative count of Article Views (full-text article views including HTML views, PDF and ePub downloads, according to the available data) and Abstracts Views on Vision4Press platform.
Data correspond to usage on the plateform after 2015. The current usage metrics is available 48-96 hours after online publication and is updated daily on week days.
Initial download of the metrics may take a while.