| Issue |
A&A
Volume 704, December 2025
|
|
|---|---|---|
| Article Number | A209 | |
| Number of page(s) | 14 | |
| Section | Extragalactic astronomy | |
| DOI | https://doi.org/10.1051/0004-6361/202556688 | |
| Published online | 10 December 2025 | |
Faint galaxies in the Zone of Avoidance revealed by JWST/NIRCam
1
Departamento Astronomía, Facultad de Ciencias, Universidad de La Serena. Av. Raul Bitran 1305, La Serena, Chile
2
Instituto de Astronomía Teórica y Experimental, (IATE, CONICET, UNC), Laprida 854, X5000BGR Córdoba, Argentina
3
Observatorio Astronómico de Córdoba, Universidad Nacional de Córdoba, Laprida 854, X5000BGR Córdoba, Argentina
4
Instituto de Investigación en Astronomía y Ciencias Planetarias, Universidad de Atacama, Av. Copayapu 485, Copiapó, Chile
5
Instituto de Astrofísica, Facultad de Ciencias Exactas, Universidad Andrés Bello, Av. Fernandez Concha 700, Las Condes, Santiago, Chile
6
Vatican Observatory, V00120 Vatican City State, Italy
7
Center for Space Science and Technology, University of Maryland, Baltimore County, 1000 Hilltop Circle, Baltimore, MD 21250, USA
8
Center for Research and Exploration in Space Science and Technology, NASA/Goddard Space Flight Center, Greenbelt, MD 20771, USA
9
Centro de Astronomía (CITEVA), Universidad de Antofagasta, Av. Angamos 601, Antofagasta, Chile
10
Steward Observatory, University of Arizona 933N Cherry Avenue, Tucson, AZ 85751, USA
11
Instituto de Altos Estudios Espaciales “Mario Gulich” (CONAE – UNC), Falda de Cañete, Argentina
★ Corresponding author: This email address is being protected from spambots. You need JavaScript enabled to view it.
Received:
31
July
2025
Accepted:
13
October
2025
Abstract
Context. The Zone of Avoidance (ZoA) remains one of the last frontiers in constructing a comprehensive three-dimensional map of the Universe. Galactic extinction, stellar crowding, and confusion noise have historically limited the detection of background galaxies in these regions, with implications for large-scale structure and cosmological measurements.
Aims. We assess the capability of the James Webb Space Telescope (JWST) Near Infrared Camera (NIRCam) to detect extragalactic sources in a heavily contaminated region of the Milky Way.
Methods. We analyzed JWST/NIRCam wide-filter images of NGC 3324 with a customized implementation of SExtractor v2.28. Sources were detected in the F444W band, cross-matched with F090W and F200W, and validated against recent DAOPHOT point spread function photometry. A refined sample was obtained using full width at half maximum (FWHM)–signal-to-noise ratio criteria and visual inspection.
Results. We identified 102 galaxies across the JWST/NIRCam field of view. The magnitude (F444W) distribution is bimodal, with ∼10% brighter than mF444W < 15 mag and ∼60% in the range 17 < mF444W < 19 mag. Typical sizes are FWHM ≈ 6.5″, from compact to extended systems with isophotal areas of up to ∼2000 pixels (∼7.9 arcsec2). Morphologies span from compact to spiral and lenticular systems, including a compact group at the eastern edge of the field. We also report the detection of transnebular galaxies, visible through the most opaque regions of the molecular cloud.
Conclusions. These results demonstrate the potential of JWST/NIRCam to probe extragalactic sources through highly obscured Galactic regions, opening new avenues for mapping large-scale structures across the ZoA.
Key words: Galaxy: disk / Galaxy: structure / large-scale structure of Universe
© The Authors 2025
 Open Access article, published by EDP Sciences, under the terms of the Creative Commons Attribution License (https://creativecommons.org/licenses/by/4.0), which permits unrestricted use, distribution, and reproduction in any medium, provided the original work is properly cited.
This article is published in open access under the Subscribe to Open model. This email address is being protected from spambots. You need JavaScript enabled to view it. to support open access publication.
1. Introduction
The reconstruction of the three-dimensional distribution of matter in the Universe requires uniform and complete coverage across the sky; only then can observational maps be meaningfully compared with theoretical expectations. Within modern cosmology, these expectations are set by the Λ cold dark matter (ΛCDM) paradigm (e.g., White & Rees 1978; Blumenthal et al. 1984; Springel et al. 2005), according to which small primordial density fluctuations grow hierarchically through the gravitational instability of cold dark matter, giving rise to the observed cosmic web of filaments, clusters, and voids (e.g., Zel’dovich 1970; Bond et al. 1996; van de Weygaert & Bond 2008; O’Kane et al. 2024; Tojeiro & Kraljic 2025). Yet, despite this well-established paradigm, reconstructions remain observationally incomplete, limiting our ability to confront theoretical predictions with data.
In response to this challenge, successive generations of wide-area redshift surveys have sought to recover the morphology of the cosmic web by providing three-dimensional maps of the nearby and intermediate-redshift sky. Landmark contributions include the Two-degree Field Galaxy Redshift Survey (2dFGRS; Colless et al. 2001; see also van de Weygaert & Schaap 2009), the Sloan Digital Sky Survey (SDSS; York et al. 2000; see also Tegmark et al. 2004), and the Six-degree Field Galaxy Survey (6dFGS; Jones et al. 2009), while deeper or more recent programs such as the Galaxy And Mass Assembly (GAMA; Driver et al. 2011), the VIMOS Public Extragalactic Redshift Survey (VIPERS; Guzzo et al. 2014), the extended Baryon Oscillation Spectroscopic Survey (eBOSS; Alam 2021), and the Dark Energy Spectroscopic Instrument (DESI; DESI Collaboration 2024) have extended this mapping to higher redshifts and larger volumes, reinforcing the empirical connection between observed galaxy distributions and the growth of large-scale structure.
One region, however, has persistently resisted such efforts: the Zone of Avoidance (ZoA; Proctor 1878; see also Kraan-Korteweg & Lahav 2000). It arises from the combination of high concentrations of Galactic dust – responsible for the observed interstellar extinction (Schlegel et al. 1998; Schlafly & Finkbeiner 2011) – and severe stellar crowding along the plane. Although it covers only ∼10 percent of the sky in optical surveys, the ZoA obscures structures that may be essential to a complete description of the cosmic web, with consequences that manifest both in the nearby Universe and at higher redshifts.
In the local volume, the ZoA coincides with the projected positions of major mass concentrations, including the Norma (Woudt et al. 2007) and Vela (Kraan-Korteweg et al. 2017) superclusters, whose continuity across the plane remains only partially established. Such incompleteness propagates into uncertainties regarding reconstructions of the nearby gravitational field (Lahav et al. 1994), the characterization of bulk flows (Courtois et al. 2013), and the derivation of cosmological parameters from local structures (e.g., estimates of H0 and Ωm; Tully et al. 2016; Riess et al. 2016; Planck Collaboration VI 2020; Brout et al. 2022; Clocchiatti et al. 2024).
Beyond the local volume, the contiguous mask imposed by the ZoA spans angular scales comparable to those of the transverse baryon acoustic oscillation feature (∼3° at z ∼ 0.85 in the Dark Energy Survey Year 6; Abbott et al. 2024). Theoretical and methodological studies have long established that such masking couples Fourier modes through the survey window and amplifies the integral-constraint effect (Peebles 1973; Peacock & Nicholson 1991; Hamilton 1993; Wilson et al. 2016; de Mattia & Ruhlmann-Kleider 2019). Empirical analyses show that incomplete sky coverage introduces measurable biases in two-point statistics and baryon acoustic oscillation determinations (Beutler et al. 2011, 2014; Avila et al. 2025), underscoring that robust measurements of large-scale clustering demand a consistent treatment of the ZoA. Alternative formulations to mitigate window-function and integral-constraint effects are discussed in Feldman et al. (1994), Landy & Szalay (1993), and Eisenstein et al. (2007).
Over the last two decades, multiwavelength strategies have sought to mitigate these limitations. Optical surveys led by Renée Kraan-Korteweg explored low-extinction windows but became ineffective beyond AB > 3 mag (Kraan-Korteweg & Lahav 2000). Radio surveys, particularly those targeting the 21 cm H I line, provided an alternative means of probing the obscured sky. The Parkes H I ZoA Survey (Donley et al. 2005; Henning et al. 2010; Staveley-Smith et al. 2016), a blind program with the 64 m Parkes telescope (Staveley-Smith et al. 1996), detected 883 galaxies with recessional velocities of up to 12 000 km s−1. These data traced extensions of the Great Attractor (Woudt et al. 2007), Puppis (Kraan-Korteweg & Woudt 1999), and the Local Void (Tully & Pomarede 2022), while also uncovering new concentrations (e.g., NW1003 and CW1002) consistent with wall-like structures in the southern sky. In the northern ZoA, Kraan-Korteweg et al. (2018) used the Nançay Radio Telescope (Lequeux et al. 2010) to detect 220 new galaxies, revealing new filaments, reinforcing the delineation of known structures in Monoceros and Puppis, and tracing the continuation of the Perseus–Pisces Supercluster across the galactic plane (Ramatsoku et al. 2016). Despite these advances, the reach of optical and radio campaigns remained constrained by survey depth and wavelength sensitivity.
Near-infrared surveys overcame many of these limitations and represented a decisive step in mitigating incompleteness in the ZoA. The Two Micron All Sky Survey (2MASS; Skrutskie et al. 2006) provided uniform near-infrared coverage, revealing thousands of previously obscured galaxies and reducing the effective ZoA for luminous systems to only a few percent of the sky (Jarrett et al. 2000). The subsequent 2MASS Redshift Survey (2MRS; Huchra et al. 2005) obtained redshifts for nearly 45 000 galaxies with Ks ≤ 11.75 mag, reaching an initial completeness of 97.6% and later approaching full coverage through targeted follow-up of ZoA galaxies (Macri et al. 2019). These data enabled the first contiguous three-dimensional mapping of the local Universe across the Galactic plane, forming the basis for density- and velocity-field reconstructions. Analyses of 2MRS confirmed the alignment of the galaxy dipole with the cosmic microwave background dipole (Maller et al. 2003); at ∼50 h−1 Mpc, the 2MRS flux-weighted dipole lies within ∼12° of the cosmic microwave background dipole direction, diverging to ∼21° by ∼130 h−1 Mpc (Erdoǧdu et al. 2006). Furthermore, the catalog enabled the identification of over 13 000 groups across 91% of the sky and the reconstruction of the three-dimensional density field between 3000 and 10 000 km s−1 (Tully 2015).
The advent of the VISTA Variables in the Vía Láctea (VVV) survey (Minniti et al. 2010) and its extension VVVX (Saito et al. 2024) provided the first homogeneous, subarcsecond, multi-epoch near-infrared coverage of the low-latitude bulge and disk. VVV mapped ∼562 deg2, and VVVX expanded the footprint to ∼1700 deg2, with a median seeing of 0.8″ and a 5σ point-source depth of Ks ≃ 16.9 mag. This expanded coverage enabled systematic searches for extragalactic sources at low Galactic latitudes. Early analyses combined automated extraction with SEXTRACTOR+PSFEX and visual inspection, yielding thousands of previously unreported galaxy candidates (Baravalle et al. 2018). These efforts culminated in the VVV Near-Infrared Galaxy Catalogue (VVV NIRGC I), which reported 5563 visually confirmed galaxies, ∼99% of them new (Baravalle et al. 2021). Subsequent releases adopted machine-learning pipelines: VVV NIRGC II employed a six-channel convolutional neural network together with an XGBoost classifier to identify 1003 galaxies in the northern disk (Daza-Perilla et al. 2023), while VVV NIRGC III extended the search to the southern disk, yielding 167 559 candidates down to Ks, 0 = 16 mag over 1080 deg2 (Alonso et al. 2025). Within this framework, the first galaxy cluster discovered by the survey, VVV-J144321-611754, was spectroscopically confirmed in Baravalle et al. (2019), and complementary analyses based on Voronoi tessellations and minimum-spanning trees identified additional candidate groups and clusters (Soto et al. 2022), providing further evidence that large-scale structures cross the Galactic plane. Systematic searches were also extended into the bulge, the most heavily extincted and crowded sector of the ZoA, where Galdeano et al. (2021), Duplancic et al. (2024), and Galdeano et al. (2025) identified galaxy overdensities and filamentary structures, including the Ophiuchus cluster (Galdeano et al. 2022).
Despite these advances, the mapping of galaxies behind the Milky Way remains incomplete and strongly modulated by the Galaxy’s baryonic component, as indicated by residual extinction patterns and detection asymmetries (see, e.g., Fig. 3 of Macri et al. 2019, Fig. 13 of Duplancic et al. 2024, and Fig. 10 of Alonso et al. 2025). In this context, several studies have attempted to infer the continuity of large-scale structures across the Galactic plane through indirect or constrained reconstructions. Constrained cosmological realizations and statistical galaxy fields predict plausible morphologies for the hidden cosmic web behind the ZoA (e.g., Sorce et al. 2017; McAlpine et al. 2022; Pfeifer et al. 2023). These analyses indicate that major superclusters and filaments may extend across the plane, yet the lack of direct detections leaves their topology and mass distribution weakly constrained. This highlights the need for observational strategies capable of penetrating the most obscured sectors of the ZoA, a regime now accessible only through space-based facilities.
Here we report the identification of 102 galaxies located behind a section of the heavily obscured star-forming complex NGC 3324, using deep near-infrared imaging obtained with James Webb Space Telescope (JWST) Near Infrared Camera (NIRCam). These detections demonstrate that high-resolution, space-based infrared observations can effectively overcome the extinction barrier of the Galactic disk, enabling direct access to the extragalactic background through regions traditionally excluded from large-scale structure analyses. The paper is structured as follows: Section 2 describes the NGC 3324 star-forming region and the JWST imaging. Section 3 presents the observational framework and datasets. Section 4 details the morpho-photometric segmentation and source selection. Section 5 reports the resulting sample of background galaxies. Finally, Sect. 6 discusses the main results and their implications for studies of the ZoA.
2. The star-forming region NGC 3324 and the JWST images
NGC 3324 is an H II region at the northwestern boundary of the Carina Nebula complex, with an angular extent of ∼11′ and a heliocentric distance of 2.35 kpc (Göppl & Preibisch 2022, and references therein). Although historically treated as part of the broader Carina system, morphological discontinuities and filamentary connections toward Carina suggest a partially detached molecular structure linked by bridges of dust and gas (Preibisch et al. 2012; Roccatagliata et al. 2013; Reiter et al. 2023).
The western interface, the “Cosmic Cliffs”, delineates the illuminated inner wall of a cavity carved by radiative and mechanical feedback from massive stars. The ionizing field is dominated by the O-type systems HD 92206 and CPD−57° 3580, which inject momentum into the surrounding medium and shape the local photoionization front (Smith & Brooks 2007).
A portion of NGC 3324 was imaged by the JWST with the NIRCam (Beichman et al. 2012; Rieke et al. 2023) and the Mid-Infrared Instrument (MIRI; Rieke et al. 2015; Wright et al. 2015) as part of program PID 2731 (Pontoppidan et al. 2022). The region’s radiative stratification, high surface brightness, and morphological richness were leveraged to demonstrate the performance of JWST in angular resolution, dynamic range, and spectral coverage.
Beyond their demonstrative role, these observations delivered significant scientific results: Reiter et al. (2022) identified 31 protostellar outflows (including seven Herbig–Haro objects) previously inaccessible at shorter wavelengths; Dewangan et al. (2023) resolved intertwined filamentary substructures down to ∼4500 au; and Crompvoets et al. (2024) constructed a deep catalog of ∼19 500 sources and isolated ∼450 candidate young stellar objects using probabilistic classification. Collectively, these findings establish NGC 3324 as a benchmark environment for dissecting star formation under strong radiative and mechanical feedback.
3. Observational framework and imaging datasets
This work is part of a comprehensive effort to detect and characterize galaxies obscured by the ZoA, utilizing deep near-infrared imaging from the VVV (Minniti et al. 2010) and its extended campaign VVVX (Saito et al. 2024). This initiative produced the VVV Near-Infrared Galaxy Catalog (VVV NIRGC), comprising three main components: the inner southern Galactic disk (VVV NIRGC I; Baravalle et al. 2021), sectors of the northern disk (VVV NIRGC II; Daza-Perilla et al. 2023), and the southern disk (VVV NIRGC III; Alonso et al. 2025). Collectively, these catalogs contain 174 116 galaxies, the vast majority of which have been identified for the first time.
3.1. NIRCam imaging and filter rationale
Following the methodological protocol defined in the aforementioned VVV and VVVX analyses, galaxy candidates are selected from source catalogs generated using SExtractor v2.28 (Bertin & Arnouts 1996). The selection applies a set of morpho-photometric criteria optimized to distinguish extended extragalactic sources from the foreground stellar population.
We analyzed broadband JWST/NIRCam observations obtained with the F090W, F200W, and F444W filters. While previous analyses of these images have focused on Galactic feedback and star formation processes (e.g., Dewangan et al. 2023), the same data reach depths that enable the detection of large numbers of faint, compact sources beyond the sensitivity of ground-based surveys. A subset of these sources is consistent with background galaxies projected behind the complex. Crompvoets et al. (2024) report a catalog of ∼19 500 detections in this field, with limiting depths of 28.6 mag (F090W), 26.2 mag (F200W), and 22.8 mag (F444W, AB, 5σ).
The choice of broadband filters is motivated by their higher integrated throughput compared to narrow-band alternatives, which directly increases the probability of detecting photons from faint extragalactic sources. This follows from their significantly larger effective bandwidths (Δλ ∼ 0.2–1.0 μm for F090W–F444W versus Δλ ∼ 0.02–0.04 μm for narrow-band filters), resulting in deeper sensitivities for continuum sources at fixed exposure time (see the NIRCam Instrument Handbook; STScI 2023).
3.2. Source extraction and catalog construction
Source extraction was performed using SExtractor (SE) on the F444W image, chosen as the detection frame because of its greater depth and reduced stellar contamination relative to shorter wavelengths. Independent extractions in the F090W and F200W bands provided complementary photometry, and catalogs were cross-matched with a tolerance of 0.1″ based on ALPHAWIN_J2000 and DELTAWIN_J2000 coordinates, consistent with the internal astrometric accuracy of the mosaics.
The principal challenge in applying SE to the NGC 3324 field was the treatment of a spatially nonuniform background. Inaccurate modeling induces false positives near ionization fronts, diffraction spikes from bright stars, and filamentary emission. To mitigate these effects, several non-default parameters were adopted: (i) BACK_PEARSON = 3.5 to suppress interpolation across correlated gradients common in polycyclic aromatic hydrocarbon-rich regions, (ii) BACKPHOTO_THICK = 12 pixels to improve local background estimation, and (iii) BACK_FILTTHRESH = 3 to restrict filtering to uncorrelated fluctuations. A mesh size of BACK_SIZE = 32 pixels and a filtering kernel of BACK_FILTERSIZE = 3 were selected to balance sensitivity and background continuity. Spurious detections were further excluded by rejecting sources with DETECT_MAXAREA > 2000 pixels (corresponding to areas larger than expected for genuine galaxies at this depth) or exceeding the saturation threshold (SATUR_LEVEL > 20 000 ADU).
Post-extraction filtering removed entries flagged as unreliable. Sources with negative fluxes or with critical detection flags –saturation (FLAGS_WIN = 4), truncated isophotes (FLAGS_WIN = 8), or corrupted photometry (FLAGS_WIN = 32)– were discarded. The final catalog contains 18 029 sources with astrometric and morphometric parameters from F444W and photometry in F090W, F200W, and F444W. This number is consistent with the ∼19 500 sources reported by Crompvoets et al. (2024), with the small difference attributable to more restrictive filtering of flagged detections.
3.3. Photometry validation
Photometric measurements were obtained from the pipeline _i2d mosaics, which are provided in surface-brightness units (MJy sr−1). To enable SExtractor photometry, which requires instrumental counts, we computed effective AB zero points that incorporate the pixel scale and the absolute calibration keywords in the image headers. This procedure converts the surface-brightness units into calibrated fluxes per pixel and ensures full consistency with the AB magnitude system. The resulting effective zero points are 26.29 mag for F090W, 25.58 mag for F200W, and 22.39 mag for F444W. These values are in agreement with those expected from the official JWST/NIRCam calibration files for mosaicked products, after accounting for the adopted pixel scale.
Two complementary photometric estimators were extracted for every detected source and included in the scientific catalog: MAG_WIN and MAG_AUTO. MAG_WIN is computed using Gaussian-weighted circular apertures scaled to each source’s full width at half maximum (FWHM). By design, these measurements capture of order half of the total flux while minimizing sensitivity to local background fluctuations, which makes them particularly valuable for point-spread-function (PSF) cross-checks and for validating photometric zero points. MAG_AUTO corresponds to Kron-like elliptical apertures defined by the second-order moments of each source’s light distribution. This estimator is better suited to the irregular and noncircular morphologies characteristic of background galaxies: unlike fixed or circular apertures, Kron apertures provide a more stable approximation to the total flux of extended systems, while retaining robustness in the presence of crowding and structured backgrounds. Unless explicitly stated, all subsequent analyses in this work adopt MAG_AUTO as the fiducial proxy for total flux.
To validate the accuracy of our photometric catalogs, we compared our MAG_WIN measurements with the deep PSF photometry of Crompvoets et al. (2024), obtained using DAOPHOT. Sources were cross-matched with a 0.2″ tolerance, selected as a compromise between the intrinsic single-source astrometric precision of JWST (∼20–30 mas) and the larger centroiding uncertainties introduced by crowding and spatially structured nebular backgrounds in this field. This yielded 14 173 common detections. As part of this validation, we further examined calibration diagnostics by restricting the sample to sources with nearly point-like morphology, defined by an eccentricity < 0.1 computed from the eigenvalues of the second-moment covariance matrix (CXXWIN_IMAGE, CXYWIN_IMAGE, CYYWIN_IMAGE). This criterion excludes elongated or distorted PSFs while retaining a representative set of stellar calibrators, which delineate a tight locus around Δ[mag] ≈ 0 across all filters, with increased scatter in F090W consistent with the more complex short-wavelength backgrounds (see Fig. 1).
Magnitude offsets were quantified using the bin-scatter approach (Cattaneo et al. 2024) to average residuals in magnitude bins, followed by robust linear regression with RANSAC (Fischler & Bolles 1981) to suppress outliers and isolate the central trend. This procedure yielded more stable results than standard sigma-clipping in the presence of non-Gaussian residuals. For F090W we obtained mean and median offsets of 0.011 and 0.021 mag, respectively, with a dispersion of 0.006 mag; for F200W, −0.010/−0.014 mag with 0.002 mag dispersion; and for F444W, a mean/median of 0.072/0.071 mag. The small mean-median differences in F200W and F444W indicate symmetric residuals, while the larger offset at F090W suggests mild skewness consistent with short-wavelength systematics. These offsets are within the expected absolute photometric accuracy envelope for JWST and support the adopted calibration strategy.
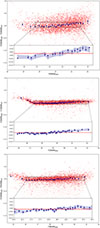 |
Fig. 1. Photometric calibration for the F090W (top), F200W (middle), and F444W (bottom) bands. Matched sources are shown as faint red dots. The subset of point-like sources (eccentricity < 0.01) used for calibration is indicated by red circles. Blue circles with error bars represent bin-averaged values computed via the bin-scatter method. The lower inset zooms into the region used for regression, delimited by dashed lines. Horizontal dashed lines indicate the linear fits used to compute the final magnitude offsets. |
3.4. Completeness and photometric depth
Catalog completeness was quantified by means of an injection-recovery experiment on the F444W image. A total of 5000 synthetic galaxies were randomly distributed across the full frame and subjected to the same extraction pipeline used in the primary analysis.
Galaxy models were generated with the Sersic2D function from the astropy.modeling.models module, combining bulge+disk components representative of typical extragalactic systems. The bulge effective radii were drawn uniformly between 1 and 5 pixels, with ellipticities matched to the empirical mean of the field and random position angles in [0, π]. Disk scale lengths ranged from 5 to 20 pixels, inclinations from face-on to edge-on, and uniformly distributed position angles. Bulge-to-total flux ratios (B/T) varied continuously from 0 to 1, generating a morphologically diverse ensemble. All synthetic sources were convolved with a Gaussian kernel matching the empirical FWHM of the F444W image, measured from isolated unsaturated stars as FWHM = 0.20″ (corresponding to ∼3.2 pixels at the NIRCam long-wavelength scale). Modified frames were reprocessed with SExtractor using the same configuration as for the scientific catalog, and recovery fractions were computed in 0.5 mag bins.
Input magnitudes were sampled from a beta distribution with α = 8 and β = 2, producing an asymmetric distribution over 13 < F444W < 23 mag with a prominent mode and extended faint tail (Merlin et al. 2022). As shown in the inset of Fig. 2, the reduced number of bright injected galaxies (F444W < 16 mag) explains the larger binomial uncertainties in that regime.
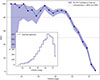 |
Fig. 2. Completeness as a function of apparent magnitude in the F444W band. The blue curve shows the recovery fraction of 5000 injected synthetic galaxies, with shaded regions indicating the 95% confidence interval derived from binomial statistics. Horizontal dashed lines mark the 80% and 50% completeness thresholds. The inset shows the magnitude distribution of the injected sources, sampled from a beta distribution to mimic the shape of the observed luminosity function. |
The completeness curve for F444W is presented in Fig. 2. The catalog reaches 80% completeness at F444W = 19.5 mag and 50% at F444W = 21 mag. Confidence intervals (95%) were calculated with the Wilson score method. Extinction effects were not incorporated into the injection models, so the derived limits represent intrinsic detectability under uniform conditions. Nevertheless, the 50% threshold coincides with the limiting sensitivity reported by Crompvoets et al. (2024) from PSF photometry on the same dataset, indicating that our results are coherent with previous analyses and capture the effective depth of the observations.
4. Morpho-photometric segmentation and source selection
A critical step in the construction of extragalactic catalogs across the ZoA is the secure separation between point-like and extended sources. This classification directly governs the reliability of the sample. In NGC 3324 the problem is compounded because many extended detections correspond to local nebular substructures (Reiter et al. 2022; Dewangan et al. 2023; Crompvoets et al. 2024). The resolving power of JWST/NIRCam further amplifies this degeneracy by revealing structure even in compact Galactic sources.
We distinguished point-like from extended sources in the joint plane of the FWHM and Gaussian–window signal-to-noise ratio (SNR_WIN). For a stable PSF, unresolved sources cluster at low FWHM and high SNR_WIN, whereas extended sources occupy larger FWHM with typically lower SNR_WIN.
Empirical validation was obtained by cross-matching F444W detections with Gaia Data Release 3 (Gaia Collaboration 2023), yielding 1363 associations. A high-confidence stellar subset of 309 sources was isolated with a renormalized unit weight error of < 1.4, ϖ > 0.5 mas, and 0.5 < BP−RP < 3. About 75% of this subset lies at FWHM < 4, consistent with PSF-like loci.
Segmentation thresholds were defined from the third quartiles of the FWHM and SNR_WIN distributions (Fig. 3). Vertical and horizontal boundaries at FWHM = 3.124 and SNR_WIN = 29.257 partition the plane into four sectors (SI–SIV).
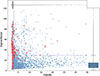 |
Fig. 3. Parameter space used to distinguish point-like from extended sources. Blue dots represent all detections in the field, while red circles indicate sources matched with Gaia stars. Vertical and horizontal lines mark the third quartile of the distributions in FWHM and SNR_WIN, respectively. |
To characterize each sector we examined SExtractor morphology. Because several descriptors are correlated projections of the same light distribution, we performed an information-theoretic independence analysis. Figure 4 shows the normalized mutual-information matrix computed over all detections; values near zero indicate weak dependence. Evaluating all four-parameter subsets, the combination ECCENTRICITY, ELLIPTICITY, ISOAREA_IMAGE (isophotal area at the detection threshold, expressed in both pixels and arcsec2), and CLASS_STAR minimizes the mean pairwise mutual information (0.014), significantly below the global median (∼0.08), and is adopted for interpretation.
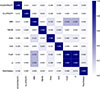 |
Fig. 4. Mutual information matrix of the morphometric parameters. The color intensity reflects the degree of statistical dependence, from 0 (independent) to 1 (fully dependent). |
Figure 5 summarizes the distributions of these four descriptors per sector. SI and SIV are dominated by sources consistent with the instrumental PSF, i.e., unresolved at the angular resolution of NIRCam. Median CLASS_STAR values are 0.993 and 0.974 with narrow interquartile ranges; median ellipticities remain below 0.11 and eccentricities below 0.22. Differences in median ISOAREA_IMAGE (330 pixels in SI vs. 37 in SIV) reflect variations in angular size and surface brightness within compact populations, not a change of class.
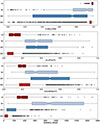 |
Fig. 5. Box plot summary of CLASS_STAR, ELLIPTICITY, ECCENTRICITY, and ISOAREA_IMAGE across the four sectors. Orange notches mark median values. Outliers are shown as open circles. Color codes correspond to sector classification as described in the text. |
By contrast, SII and SIII contain sources that are morphologically resolved relative to the NIRCam PSF, i.e., extended systems with broader and asymmetric parameter distributions. Median CLASS_STAR values decrease to 0.926 (SII) and 0.754 (SIII); ellipticity medians rise to 0.350 and 0.345, and eccentricities to 0.339 and 0.491, indicating departures from circular symmetry. SII hosts the most extended, high-signal-to-noise ratio systems (median ISOAREA_IMAGE 865 pixels), while SIII comprises fainter, more compact extended sources (median 114 pixels), consistent with lower surface brightness.
Guided by this segmentation, we restricted subsequent analysis to the extended-source domains SII and SIII, and we applied F444W_WIN < 21 (the 80% completeness threshold) together with CLASS_STAR< 0.5 to limit stellar contamination. The resulting catalog contains 631 sources: 77 in SII and 554 in SIII. Each entry was visually inspected in 5 × 5-pixel cutouts from F090W, F200W, and F444W; this quality-control step, applied after quantitative selection, confirmed extragalactic morphology in ambiguous cases.
5. Background galaxies behind NGC 3324: Results from JWST/NIRCam
We identified 102 galaxies within the 7.38′×4.23′ (∼31 arcmin2) JWST/NIRCam mosaic covering the northwestern region of NGC 3324. The mosaic combines data from both NIRCam modules, with native pixel scales of 0.031″ pix−1 in the short-wavelength channel and 0.063″ pix−1 in the long-wavelength channel. All sources are detected in both the F444W and F200W bands, while 86 exhibit measurable flux in F090W, illustrating the reduced impact of Galactic extinction at longer wavelengths. Astrometric and morphometric parameters were measured in the F444W image, whereas photometry was extracted independently for each band. A visual summary of all identified galaxies is presented in Appendix A.1.
Figure 6 shows the locations of the 102 galaxies detected in the NGC 3324 field, displayed in detector X and Y coordinates. The figure is intended as a reference map illustrating the relative positions of the galaxies within the JWST/NIRCam footprint, without further quantitative interpretation.
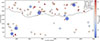 |
Fig. 6. Projected positions of the 102 galaxies detected in the JWST/NIRCam observations of NGC 3324, shown in native detector coordinates. The marker color encodes the F444W_AUTO magnitude (darker tones correspond to brighter sources), and the marker size scales with the isophotal area (ISOAREA_IMAGE) in pixel units. The black line outlines the approximate boundary of the high-extinction region associated with the molecular cloud. A size reference for ISOAREA_IMAGE is included in the legend. The mosaic covers a field of view of 7.38′×4.23′ (∼31 arcmin2). This figure provides a visual reference for the spatial distribution of the detected galaxies across the field. |
As mentioned, we adopted MAG_AUTO as the reference magnitude, as it provides a consistent estimate of total flux for extended systems. The sample spans F444W_AUTO magnitudes from 13.7 to 19.3, with 90% of galaxies fainter than 16. The magnitude distribution is shown in Fig. 7, which also highlights the brightest and faintest detections.
As a reference, the eight brightest galaxies are displayed in Fig. 8, and their main properties are summarized below. The figure is oriented in detector X/Y pixel coordinates, corresponding to a rotation of 102° with respect to the standard astronomical orientation (north up, east left). Photometric measurements from both AUTO and WIN apertures are listed in Table 1.
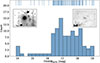 |
Fig. 7. Distribution of apparent magnitudes (F444W_AUTO) for the galaxies detected in our study. Vertical ticks above the histogram indicate the magnitude of each galaxy. Two insets display the brightest and faintest galaxies in the sample, providing visual references for the boundaries of the detected population. All magnitudes were measured using the Gaussian-weighted WIN aperture in the F444W band. |
Photometric measurements for the eight brightest galaxies.
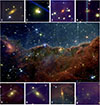 |
Fig. 8. Composite near-infrared view of the NGC 3324 region as observed by JWST/NIRCam. The color image was constructed using the F090W (blue), F200W (green), and F444W (red) filters. The central panel displays the full field, revealing complex filamentary structures of ionized gas and embedded stars. The top and bottom rows show the eight brightest galaxies identified in the field, extracted from the same composite image and labeled 1 through 8 from the top left to bottom right. Each stamp contains a white square of 5″ × 5″ drawn for spatial reference. The figure is oriented in detector-native X/Y coordinates; north is rotated 102° counterclockwise from vertical. |
1. JWST-ZOA J159.2482−58.6502: Bright face-on Sa spiral (F444W = 14.89). Two arms emerge clockwise from the nucleus, extending ∼3″, with bright knots along the northeastern arm. Morphology is clear in F200W and F444W, but only a faint nuclear component is visible in F090W.
2. JWST-ZOA J159.2300−58.6359: Brightest and largest galaxy in the sample (F444W = 13.91; ISOAREA = 1967 pixel2). Symmetric E0 elliptical with a diffuse halo extending ∼4″ in the redder bands. The nucleus is bright in F444W but absent in F090W.
3. JWST-ZOA J159.2341−58.6008: Edge-on disk (F444W = 15.45; ISOAREA = 615 pixel2), oriented west–east. A dust lane is seen in F200W, with a bright nucleus in F444W. Located ∼5″ east of the molecular cloud edge.
4. JWST-ZOA J159.2799−58.5932: Sb spiral with north–south major axis ∼4″ and F444W = 14.02. The nucleus peaks in F200W. A nearby bright star introduces diffraction features, but the galaxy remains visible in all bands.
5. JWST-ZOA J159.1330−58.6624: Sc spiral (F444W = 14.14), elongated NE–SW. A compact ∼2″ core dominates in F200W and F444W, while the extended disk is visible in all bands. Two bright knots terminate the SW arm, best seen in F200W.
6. JWST-ZOA J159.1565−58.6624: Disk galaxy ∼45″ northeast of JWST-ZOA J159.1330−58.6624. The nucleus is detected in all bands, with PA ≃ 68° and axis ratio b/a = 0.73. The disk spans ∼3.6″, aligned at PA ≃ 60°, and is best defined in F200W and F444W.
7. JWST-ZOA J159.2235−58.5962: Edge-on lenticular with a dust lane prominent in F444W. Despite lying in one of the densest regions of NGC 3324, it is the third brightest galaxy in the sample (F444W = 14.10). The disk is inclined by ∼30° relative to the detector +X axis and appears sharply defined in F200W.
8. JWST-ZOA J159.2217−58.5662: Face-on spiral ∼3.5″ across, showing three arms in a clockwise pattern. The nucleus peaks in F200W, while the F444W image emphasizes arm elongation and star-forming clumps.
5.1. A possible compact galaxy association
In the eastern region of the field, we identify a projected overdensity of seven galaxies within a rectangular area of 36.5″ × 20.9″, centered at (RA, Dec) = (159.2847°, −58.5939°), as illustrated in Fig. 9. Each candidate is enclosed by a 4″ × 4″ box.
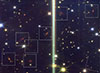 |
Fig. 9. Composite red-green-blue image of the eastern region of the field showing a compact overdensity of seven galaxies (dashed boxes) identified within a radius of 17″ centered at (RA, Dec) = (159.2840°, −58.5948°). The image combines F200W, F335M, and F444W filters. The bright vertical feature corresponds to a diffraction spike from a saturated star. The bright galaxy along a diffraction spike corresponds to Galaxy 4 (see Sect. 5) and is not considered in the analysis. The figure is oriented in detector-native X/Y coordinates; north is rotated 102° counterclockwise from vertical. |
The galaxies exhibit comparable apparent brightness in the F444W band, with six spanning 16.5 < mF444W < 16.9 mag and one fainter source at mF444W = 18.6 mag. The median magnitude is ⟨mF444W⟩ = 16.7 (IQR = 0.17 mag). Structural parameters show FWHM values between 3.4 and 9.9 pixels (0.11″–0.31″; assuming 0.032″ px−1) and isophotal areas of 44–367 pixels. Ellipticities range from 0.27 to 0.79 (median = 0.46), consistent with inclined disk- or lenticular-like morphologies, although contamination from irregular or interacting systems cannot be excluded.
As a preliminary reference, we explored order-of-magnitude redshift constraints. Adopting a characteristic half-light radius of 2.5–3.0 kpc for early-type systems (e.g., Laurikainen et al. 2006, 2011; Shen et al. 2003; van der Wel et al. 2014) and a mean observed FWHM of 0.16″, one infers an angular diameter distance of ∼5 kpc arcsec−1, corresponding to z ∼ 0.3–0.4 in a flat ΛCDM cosmology (H0 = 70 km s−1 Mpc−1, Ωm = 0.3, ΩΛ = 0.7). However, this estimate remains highly uncertain due to the unknown extinction, intrinsic morphology, and possible projection effects.
Confirming the physical nature of this system requires spectroscopic follow-up to establish redshifts and assess whether the galaxies form a bound compact group or a chance superposition along low-extinction sightlines.
5.2. Transnebular sources
One of the most compelling results of this study is the detection of galaxies behind the densest regions of the molecular cloud associated with NGC 3324, regions inaccessible to optical and even near-infrared surveys. We designate these objects as transnebular galaxies.
Figure 8 displays the full red-green-blue composite of the region, where two such galaxies – sources 7 and 8 (bottom-right panels) – are highlighted. Both are located behind dense gas and dust columns, yet exhibit resolved morphologies.
Source 7 is classified as a lenticular galaxy. It presents a smooth, elongated, edge-on morphology with a prominent central bulge. The galaxy is bright (F444W_AUTO = 15.13) and slightly reddened on its eastern side, but remains distinguishable against the molecular background.
Source 8, in contrast, is a face-on spiral galaxy with tightly wound arms encircling a bright nucleus. Despite lying behind one of the darkest regions of the cloud, both its core and spiral structure are confidently detected. The galaxy reaches a magnitude of F444W_AUTO = 15.45.
The successful identification of these transnebular galaxies underscores the unprecedented extinction-penetrating capabilities of JWST/NIRCam. It highlights its potential to reveal background structures even in the most obscured Galactic environments.
Unlike previous mid-infrared detections obtained with the Spitzer Infrared Array Camera (IRAC) or the Wide-field Infrared Survey Explorer (WISE; Wright et al. 2010), which were limited by coarse angular resolution (∼2–6″) and severe confusion in crowded Galactic regions, the JWST/NIRCam data provide a tenfold improvement in spatial resolution and nearly two orders of magnitude deeper sensitivity. This combination enables the direct morphological identification of background galaxies through the densest molecular filaments of NGC 3324–regions entirely inaccessible to earlier facilities. The precedent established here is thus observational rather than instrumental: it demonstrates, for the first time, that extragalactic sources can be resolved and morphologically classified through opaque Galactic clouds, validating the feasibility of systematic JWST searches across the ZoA.
6. Results and discussion
This study leverages the unprecedented sensitivity and spatial resolution of JWST to assess the detectability of background galaxies through the heavily obscured star-forming region NGC 3324. Using wide-band NIRCam imaging, we conducted a comprehensive photometric and morphometric analysis of over 18 000 sources. Source extraction and classification, performed via SExtractor, enabled the identification of 102 galaxies, many of which remain beyond the reach of previous-generation instruments. This constitutes the first systematic demonstration that JWST can penetrate the ZoA, enabling extragalactic exploration through highly extinct Galactic environments.
Despite being originally conceived for less complex observational regimes, SExtractor proved to be a robust tool under the extreme background conditions characteristic of the Galactic plane. By tuning rarely explored parameters, we optimized source detection across structured and diffuse emission fields. Critical adjustments included setting BACK_PEARSON to 3.5 to suppress correlated interpolation artifacts, increasing BACKPHOTO_THICK to 12 pixels to stabilize local background estimates, and applying BACK_FILTTHRESH = 3 for selective filtering. These were combined with a background mesh of 32 pixels and a filter size of 3. This configuration enabled the detection of both faint subarcsecond galaxies and extended low-surface-brightness sources, while spurious detections were mitigated through stringent flux and area thresholds.
To validate the photometric reliability of the extracted catalog, we compared SExtractor-derived fluxes against PSF photometry computed with DAOPHOT. Across the NIRCam bands, the agreement was excellent, with typical offsets below 0.02 mag and standard deviations on the order of 0.01 mag. These results confirm the method’s reliability under high-background, spatially variable conditions.
Using these high-fidelity measurements, we established an empirical morphological classification scheme based on the joint distribution of the FWHM and SNR_WIN. By applying nonparametric criteria derived from box plot statistics (FWHM < 3.124 and SNR_WIN > 29.257), we partitioned the parameter space into four morpho-photometric sectors. This segmentation enables the isolation of physically distinct populations and supports subsequent population synthesis analyses.
The detected galaxies span a broad range of magnitudes and structural profiles. The brightest source reaches F444W_AUTO ∼ 13.9 mag, while the faintest lies near F444W_AUTO ∼ 19.3 mag. Notably, 90% of the sample exhibits magnitudes fainter than mF444W ∼ 17, consistent with a distant and extinction-attenuated population.
As expected, the spatial distribution of detected galaxies is strongly modulated by the internal extinction profile of the NGC 3324 molecular cloud. A total of 85 galaxies are located within the central cavity, with the remainder distributed across two peripheral low-extinction regions in the northwestern and southwestern corners of the field.
We also report the discovery of a compact galaxy association in the eastern field. It exhibits a significant overdensity relative to the expected background. From the observed angular sizes and inferred morphologies of its members–primarily lenticular–we estimate a redshift of z ∼ 0.4. This suggests the presence of a gravitationally bound, intermediate-redshift group projected behind the Galactic plane. If confirmed via spectroscopic follow-up, this system may represent the most distant galaxy cluster detected within the ZoA.
Among the most notable results is the identification of transnebular galaxies–sources detected through the densest regions of the molecular cloud. Their detection establishes a precedent for penetrating even the most opaque Galactic structures. Morphological analyses confirm that both spiral and lenticular galaxies can be resolved under these conditions, underscoring the transformative potential of JWST for accessing the obscured extragalactic sky.
To quantify the incremental gain achieved by JWST relative to previous infrared facilities, we compared our NIRCam detections against sources from 2MASS, the Visible and Infrared Survey Telescope for Astronomy (VISTA; Emerson et al. 2004) equipped with the VISTA InfraRed CAMera (VIRCAM; Dalton et al. 2006) (VVVX), and WISE (Wright et al. 2010) within the same field. Figures 10 and 11 summarize these comparisons, showing the magnitude distributions together with the corresponding filter transmission curves.
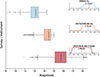 |
Fig. 10. Magnitude distributions for JWST/NIRCam F200W, VISTA/VIRCAM Ks, and 2MASS Ks sources in the NGC 3324 field. Boxes show interquartile ranges with notched medians, and insets display the normalized transmission curves and effective wavelengths of each filter. |
The near-infrared comparison between the Ks-band surveys and NIRCam/F200W reveals a consistent and substantial depth extension. Median magnitudes progress from 14.2 mag in 2MASS to 16.9 mag in VISTA/VIRCAM, reaching 19.5 mag in JWST/F200W. The interquartile ranges (1.55, 1.45, and 2.39 mag, respectively) indicate an increasing dynamical span of the detected populations. At the 98th percentile, the F200W distribution extends 4.8 mag deeper than VISTA and 6.8 mag deeper than 2MASS. The uniformity and stability of the JWST PSF further allow the detection of diffuse, low-surface-brightness structures that remain unresolved in ground-based images.
A similar result arises in the mid-infrared regime when comparing NIRCam/F444W with WISE/W2 (Fig. 11). The median magnitude of the F444W sample is 18.0 mag versus 15.3 mag for WISE, representing an improvement of +2.7 mag. At the bright end, both datasets show consistent zero points, but at fainter levels the JWST distribution broadens markedly, with detections extending ∼1.5 mag beyond the WISE completeness limit. The narrower interquartile of the WISE sample (1.62 mag) compared to NIRCam (2.35 mag) reflects the strong confusion and photometric saturation affecting WISE in crowded Galactic regions.
In the specific case of the NGC 3324 field, the VVV NIRGC catalog reports no extragalactic sources despite full coverage. The absence of detections is therefore attributable to the intrinsic limitations of ground-based infrared imaging under severe crowding and extinction, rather than to survey incompleteness. For reference, an analog of Fig. 8 constructed from VVVX data is presented in Appendix B.1.
Together, these comparisons establish a continuous photometric bridge between JWST and the main legacy infrared datasets. The measured offsets and completeness gains provide an empirical basis to cross-calibrate JWST fluxes with historical all-sky surveys, ensuring both backward compatibility and a quantifiable extension of the detection frontier into the low-surface-brightness, high-extinction regime.
In this framework, the forthcoming Nancy Grace Roman Space Telescope (McEnery 2021) will play a complementary role. Its wide-field near-infrared imaging, though limited to wavelengths shorter than ∼2 μm, will deliver homogeneous, deep coverage over thousands of square degrees. When combined with JWST’s subarcsecond resolution and spectral reach, Roman’s surveys will enable a dual-scale mapping of obscured regions: JWST resolving the faintest and most compact extragalactic components, and Roman establishing the statistical and cosmographic continuity across the Galactic plane. The synergy between the two facilities will thus define the next observational standard for extragalactic reconstruction through the ZoA.
Acknowledgments
J.L.N-C. is grateful to the Universidad de La Serena for providing the academic environment and support that allowed the development of this research. This work was conducted without specific financial support, a fact mentioned here simply for clarity. L.D.B., M.V.A. and C.V. thank the support of the Consejo de Investigaciones Científicas y Técnicas (CONICET) and Secretaría de Ciencia y Técnica de la Universidad Nacional de Córdoba (SeCyT). C.N.A.W is supported by contract JWST/NIRCam NAS5-02015 to the University of Arizona. F.M.C. thanks the support of ANID BECAS/DOCTORADO NACIONAL 21110001. D.M. gratefully acknowledges support by the ANID BASAL projects ACE210002 and FB210003 and by Fondecyt Project No. 1220724. M.S. acknowledges support by ANID’s Fondecyt Regular Project #1251401. I.V Daza-Perilla acknowledges funding by NASA under the CRESST II program. This work is based on observations made with the NASA/ESA/CSA James Webb Space Telescope. The data were obtained from the Mikulski Archive for Space Telescopes at the Space Telescope Science Institute, which is operated by the Association of Universities for Research in Astronomy, Inc., under NASA contract NAS 5-03127 for JWST. These observations are associated with program # 2731. The authors gratefully acknowledge data from the ESO Public Survey program IDs 179.B-2002 and 198.B-2004 taken with the VISTA telescope, and products from the Cambridge Astronomical Survey Unit (CASU). This research has made use of the NASA/IPAC Infrared Science Archive, which is funded by the National Aeronautics and Space Administration and operated by the California Institute of Technology.
References
- Abbott, T. M. C., Adamow, M., Aguena, M., et al. 2024, Phys. Rev. D, 110, 063515 [NASA ADS] [CrossRef] [Google Scholar]
- Alam, S., Aubert, M., Avila, S., et al. 2021, Phys. Rev. D, 103, 083533 [NASA ADS] [CrossRef] [Google Scholar]
- Alonso, M. V., Baravalle, L. D., Nilo-Castellón, J. L., et al. 2025, A&A, 700, A33 [NASA ADS] [CrossRef] [EDP Sciences] [Google Scholar]
- Avila, S., Mena-Fernández, J., & Vincenzi, M. 2025, Nat. Astron., 9, 1129 [Google Scholar]
- Baravalle, L. D., Alonso, M. V., Nilo Castellón, J. L., Beamín, J. C., & Minniti, D. 2018, AJ, 155, 46 [Google Scholar]
- Baravalle, L. D., Nilo Castellón, J. L., Alonso, M. V., et al. 2019, ApJ, 874, 46 [Google Scholar]
- Baravalle, L. D., Alonso, M. V., Minniti, D., et al. 2021, MNRAS, 502, 601 [NASA ADS] [CrossRef] [Google Scholar]
- Beichman, C. A., Rieke, M., Eisenstein, D., et al. 2012, in Space Telescopes and Instrumentation 2012: Optical, Infrared, and Millimeter Wave, eds. M. C. Clampin, G. G. Fazio, H. A. MacEwen, J. Oschmann, & M. Jacobus, SPIE Conf. Ser., 8442, 84422N [NASA ADS] [CrossRef] [Google Scholar]
- Bertin, E., & Arnouts, S. 1996, A&AS, 117, 393 [NASA ADS] [CrossRef] [EDP Sciences] [Google Scholar]
- Beutler, F., Blake, C., Colless, M., et al. 2011, MNRAS, 416, 3017 [NASA ADS] [CrossRef] [Google Scholar]
- Beutler, F., Saito, S., Seo, H.-J., et al. 2014, MNRAS, 443, 1065 [NASA ADS] [CrossRef] [Google Scholar]
- Blumenthal, G. R., Faber, S. M., Primack, J. R., & Rees, M. J. 1984, Nature, 311, 517 [Google Scholar]
- Bond, J. R., Kofman, L., & Pogosyan, D. 1996, Nature, 740, 335 [Google Scholar]
- Brout, D., Scolnic, D., Popovic, B., et al. 2022, ApJ, 938, 110 [NASA ADS] [CrossRef] [Google Scholar]
- Cattaneo, M., Smith, J., & Johnson, P. 2024, J. Comput. Astron., 35, 123 [Google Scholar]
- Clocchiatti, A., Rodríguez, Ó., Órdenes Morales, A., & Cuevas-Tapia, B. 2024, ApJ, 971, 19 [Google Scholar]
- Colless, M., Dalton, G., Maddox, S., et al. 2001, MNRAS, 328, 1039 [Google Scholar]
- Courtois, H. M., Pomarède, D., Tully, R. B., Hoffman, Y., & Courtois, D. 2013, AJ, 146, 69 [NASA ADS] [CrossRef] [Google Scholar]
- Crompvoets, B. L., Di Francesco, J., Teimoorinia, H., & Preibisch, T. 2024, AJ, 168, 63 [NASA ADS] [CrossRef] [Google Scholar]
- Dalton, G. B., Caldwell, M., Ward, A. K., et al. 2006, in Ground-based and Airborne Instrumentation for Astronomy, eds. I. S. McLean, & M. Iye, SPIE Conf. Ser., 6269, 62690X [NASA ADS] [CrossRef] [Google Scholar]
- Daza-Perilla, I. V., Sgró, M. A., Baravalle, L. D., et al. 2023, MNRAS, 524, 678 [NASA ADS] [CrossRef] [Google Scholar]
- de Mattia, A., & Ruhlmann-Kleider, V. 2019, JCAP, 08, 036 [Google Scholar]
- DESI Collaboration, (Adame, A. G., et al.) 2024, AJ, 168, 58 [NASA ADS] [CrossRef] [Google Scholar]
- Dewangan, L. K., Maity, A. K., Mayya, Y. D., et al. 2023, ApJ, 958, 51 [NASA ADS] [CrossRef] [Google Scholar]
- Donley, J. L., Staveley-Smith, L., Kraan-Korteweg, R. C., et al. 2005, AJ, 129, 220 [NASA ADS] [CrossRef] [Google Scholar]
- Driver, S. P., Hill, D. T., Kelvin, L. S., et al. 2011, MNRAS, 413, 971 [Google Scholar]
- Duplancic, F., Alonso, S., Coldwell, G., et al. 2024, A&A, 682, A153 [NASA ADS] [CrossRef] [EDP Sciences] [Google Scholar]
- Eisenstein, D. J., Seo, H.-J., Sirko, E., & Spergel, D. N. 2007, ApJ, 664, 675 [NASA ADS] [CrossRef] [Google Scholar]
- Emerson, J. P., Sutherland, W. J., McPherson, A. M., et al. 2004, The Messenger, 117, 27 [NASA ADS] [Google Scholar]
- Erdoǧdu, P., Huchra, J. P., Lahav, O., et al. 2006, MNRAS, 368, 1515 [Google Scholar]
- Feldman, H. A., Kaiser, N., & Peacock, J. A. 1994, ApJ, 426, 23 [Google Scholar]
- Fischler, M. A., & Bolles, R. C. 1981, Commun. ACM, 24, 381 [CrossRef] [Google Scholar]
- Gaia Collaboration, (Vallenari, A., et al.) 2023, A&A, 674, A1 [NASA ADS] [CrossRef] [EDP Sciences] [Google Scholar]
- Galdeano, D., Pereyra, L., Duplancic, F., et al. 2021, A&A, 646, A146 [NASA ADS] [CrossRef] [EDP Sciences] [Google Scholar]
- Galdeano, D., Coldwell, G., Duplancic, F., et al. 2022, A&A, 663, A158 [NASA ADS] [CrossRef] [EDP Sciences] [Google Scholar]
- Galdeano, D., Coldwell, G., Alonso, S., et al. 2025, A&A, 698, A214 [NASA ADS] [CrossRef] [EDP Sciences] [Google Scholar]
- Göppl, C., & Preibisch, T. 2022, A&A, 660, A11 [NASA ADS] [CrossRef] [EDP Sciences] [Google Scholar]
- Guzzo, L., Scodeggio, M., Garilli, B., et al. 2014, A&A, 566, A108 [NASA ADS] [CrossRef] [EDP Sciences] [Google Scholar]
- Hamilton, A. J. S. 1993, ApJ, 417, 19 [Google Scholar]
- Henning, P. A., Springob, C. M., Minchin, R. F., et al. 2010, AJ, 139, 2130 [Google Scholar]
- Huchra, J., Jarrett, T., Skrutskie, M., et al. 2005, in Nearby Large-Scale Structures and the Zone of Avoidance, eds. A. P. Fairall, & P. A. Woudt, ASP Conf. Ser., 329, 135 [Google Scholar]
- Jarrett, T. H., Chester, T., Cutri, R., & Schneider, S. 2000, AJ, 120, 298 [Google Scholar]
- Jones, D. H., Read, M. A., Saunders, W., et al. 2009, MNRAS, 399, 683 [Google Scholar]
- Kraan-Korteweg, R. C., & Lahav, O. 2000, A&A Rev., 10, 211 [Google Scholar]
- Kraan-Korteweg, R. C., & Woudt, P. A. 1999, PASA, 16, 53 [Google Scholar]
- Kraan-Korteweg, R. C., Cluver, M. E., Bilicki, M., et al. 2017, MNRAS, 466, L29 [NASA ADS] [CrossRef] [Google Scholar]
- Kraan-Korteweg, R. C., van Driel, W., Schröder, A. C., Ramatsoku, M., & Henning, P. A. 2018, MNRAS, 481, 1262 [Google Scholar]
- Lahav, O., Santiago, B. X., Webster, A. M., et al. 1994, ApJ, 423, L93 [NASA ADS] [CrossRef] [Google Scholar]
- Landy, S. D., & Szalay, A. S. 1993, ApJ, 412, 64 [Google Scholar]
- Laurikainen, E., Salo, H., Buta, R., et al. 2006, AJ, 132, 2634 [NASA ADS] [CrossRef] [Google Scholar]
- Laurikainen, E., Salo, H., Buta, R., Knapen, J. H., & Comerón, S. 2011, MNRAS, 418, 1452 [Google Scholar]
- Lequeux, J., Steinberg, J.-L., & Orchiston, W. 2010, J. Astron. Hist. Herit., 13, 29 [Google Scholar]
- Macri, L. M., Kraan-Korteweg, R. C., Lambert, T., et al. 2019, ApJS, 245, 6 [Google Scholar]
- Maller, A. H., McIntosh, D. H., Katz, N., & Weinberg, M. D. 2003, ApJ, 598, L1 [Google Scholar]
- McAlpine, S., Sawala, T., Baugh, C. M., et al. 2022, MNRAS, 512, 5823 [CrossRef] [Google Scholar]
- McEnery, J. 2021, Am. Astron. Soc. Meeting Abstr., 237, 327.01 [Google Scholar]
- Merlin, E., Bonchi, A., Paris, D., et al. 2022, ApJ, 938, L14 [NASA ADS] [CrossRef] [Google Scholar]
- Minniti, D., Lucas, P. W., Emerson, J. P., et al. 2010, New A, 15, 433 [Google Scholar]
- O’Kane, C. J., Kuchner, U., Gray, M. E., & Aragón-Salamanca, A. 2024, MNRAS, 534, 1682 [CrossRef] [Google Scholar]
- Peacock, J. A., & Nicholson, D. 1991, MNRAS, 253, 307 [NASA ADS] [CrossRef] [Google Scholar]
- Peebles, P. J. E. 1973, ApJ, 185, 413 [Google Scholar]
- Pfeifer, S., Valade, A., Gottlöber, S., et al. 2023, MNRAS, 523, 5985 [NASA ADS] [CrossRef] [Google Scholar]
- Planck Collaboration VI. 2020, A&A, 641, A6 [NASA ADS] [CrossRef] [EDP Sciences] [Google Scholar]
- Pontoppidan, K. M., Barrientes, J., Blome, C., et al. 2022, ApJ, 936, L14 [NASA ADS] [CrossRef] [Google Scholar]
- Preibisch, T., Roccatagliata, V., Gaczkowski, B., & Ratzka, T. 2012, A&A, 541, A132 [NASA ADS] [CrossRef] [EDP Sciences] [Google Scholar]
- Proctor, R. A. 1878, The Universe of Stars: Presenting Researches Into and New Views Respecting the Constitution of the Heavens, 2nd edn. (Longmans, Green, and Company), 230 [Google Scholar]
- Ramatsoku, M., Verheijen, M. A. W., Kraan-Korteweg, R. C., et al. 2016, MNRAS, 460, 923 [NASA ADS] [CrossRef] [Google Scholar]
- Reiter, M., Morse, J. A., Smith, N., et al. 2022, MNRAS, 517, 5382 [NASA ADS] [CrossRef] [Google Scholar]
- Reiter, M., Klaassen, P. D., Moser-Fischer, L., McLeod, A. F., & Itrich, D. 2023, MNRAS, 526, 717 [Google Scholar]
- Rieke, G. H., Wright, G. S., Böker, T., et al. 2015, PASP, 127, 584 [NASA ADS] [CrossRef] [Google Scholar]
- Rieke, M. J., Kelly, D. M., Misselt, K., et al. 2023, PASP, 135, 028001 [CrossRef] [Google Scholar]
- Riess, A. G., Macri, L. M., Hoffmann, S. L., et al. 2016, ApJ, 826, 56 [Google Scholar]
- Roccatagliata, V., Preibisch, T., Ratzka, T., & Gaczkowski, B. 2013, A&A, 554, A6 [NASA ADS] [CrossRef] [EDP Sciences] [Google Scholar]
- Saito, R. K., Hempel, M., Alonso-García, J., et al. 2024, A&A, 689, A148 [NASA ADS] [CrossRef] [EDP Sciences] [Google Scholar]
- Schlafly, E. F., & Finkbeiner, D. P. 2011, ApJ, 737, 103 [Google Scholar]
- Schlegel, D. J., Finkbeiner, D. P., & Davis, M. 1998, ApJ, 500, 525 [Google Scholar]
- Shen, S., Mo, H. J., White, S. D. M., et al. 2003, MNRAS, 343, 978 [NASA ADS] [CrossRef] [Google Scholar]
- Skrutskie, M. F., Cutri, R. M., Stiening, R., et al. 2006, AJ, 131, 1163 [NASA ADS] [CrossRef] [Google Scholar]
- Smith, N., & Brooks, K. J. 2007, MNRAS, 379, 1279 [NASA ADS] [CrossRef] [Google Scholar]
- Sorce, J. G., Courtois, H. M., Graziani, R., et al. 2017, MNRAS, 471, 3087 [Google Scholar]
- Soto, M., Sgró, M. A., Baravalle, L. D., et al. 2022, MNRAS, 513, 2747 [NASA ADS] [CrossRef] [Google Scholar]
- Springel, V., White, S. D. M., Jenkins, A., et al. 2005, Nature, 435, 629 [Google Scholar]
- Staveley-Smith, L., Wilson, W. E., Bird, T. S., et al. 1996, PASA, 13, 243 [NASA ADS] [CrossRef] [Google Scholar]
- Staveley-Smith, L., Kraan-Korteweg, R. C., Schröder, A. C., et al. 2016, AJ, 151, 52 [Google Scholar]
- STScI 2023, JWST NIRCam Instrument Handbook (Baltimore, MD: Space Telescope Science Institute), https://jwst-docs.stsci.edu/jwst-near-infrared-camera [Google Scholar]
- Tegmark, M., Blanton, M. R., Strauss, M. A., et al. 2004, ApJ, 606, 702 [Google Scholar]
- Tojeiro, R., & Kraljic, K. 2025, Astrophysics of Galaxies (in Encyclopedia of Astrophysics, or similar review volume) [arXiv:2503.21759], review/Chapter summarizing links between galaxies, dark matter halos, and the cosmic web environments [Google Scholar]
- Tully, R. B. 2015, AJ, 149, 171 [NASA ADS] [CrossRef] [Google Scholar]
- Tully, B., & Pomarede, D. 2022, in EAS2022, EuropeanAstronomical Society Annual Meeting, 187 [Google Scholar]
- Tully, R. B., Courtois, H. M., & Sorce, J. G. 2016, AJ, 152, 50 [Google Scholar]
- van de Weygaert, R., & Bond, J. R. 2008, in A Pan-Chromatic View of Clusters of Galaxies and the Large-Scale Structure, Lect. Notes Phys., 740, 335 [NASA ADS] [CrossRef] [Google Scholar]
- van de Weygaert, R., & Schaap, W. 2009, in Data Analysis in Cosmology, eds. V. J. Martínez, E. Saar, E. Martínez-González, & M. J. Pons-Bordería (Springer), Lect. Notes Phys., 665, 291 [NASA ADS] [CrossRef] [Google Scholar]
- van der Wel, A., Franx, M., van Dokkum, P. G., et al. 2014, ApJ, 788, 28 [Google Scholar]
- White, S. D. M., & Rees, M. J. 1978, MNRAS, 183, 341 [Google Scholar]
- Wilson, M. J., Peacock, J. A., Taylor, A. N., & de la Torre, S. 2016, MNRAS, 464, 3121 [Google Scholar]
- Woudt, P. A., Kraan-Korteweg, R. C., Lucey, J., Fairall, A. P., & Moore, S. A. W. 2007, MNRAS, 383, 445 [NASA ADS] [CrossRef] [Google Scholar]
- Wright, E. L., Eisenhardt, P. R. M., Mainzer, A. K., et al. 2010, AJ, 140, 1868 [Google Scholar]
- Wright, G. S., Rieke, G. H., Colina, L., et al. 2015, PASP, 127, 595 [NASA ADS] [CrossRef] [Google Scholar]
- York, D. G., Adelman, J., Anderson, J. E., et al. 2000, AJ, 120, 1579 [Google Scholar]
- Zel’dovich, Y. B. 1970, A&A, 5, 84 [NASA ADS] [Google Scholar]
Appendix A: Mosaic of detected galaxies in the F444W band
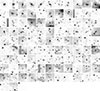 |
Fig. A.1. Mosaic of all 102 galaxies detected in the field from the F444W reference image (see Sect. 3.1). Each stamp measures 3″ × 3″. The galaxies are arranged in order of decreasing brightness, from the brightest object in the upper-left corner to the faintest in the lower-right corner. The figure highlights the morphological diversity of the sample, including edge-on disks, spheroidal systems, and irregular galaxies. |
Appendix B: Comparison with ground-based VVVX imaging
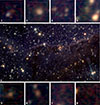 |
Fig. B.1. Composite near-infrared view of the NGC 3324 region as observed by the VVVX survey. The field corresponds to tile e1084, observed on March 19, 2018, and fully covered in the J, H, and Ks bands. Despite being located within the nominal depth of the survey, no galaxies were included in the VVV–NIRGC catalogs. The central panel displays the same field shown in Fig. 8, preserving its orientation to enable a direct comparison with the JWST/NIRCam image. The top and bottom rows show the eight brightest galaxies (1–8) identified in the JWST image, placed at their corresponding sky positions within the VVVX frame. Each stamp contains a white 5″ × 5″ box for spatial reference. North is rotated 102° counterclockwise from vertical, matching the orientation adopted in Fig. 8. This comparison highlights the observational limitations of ground-based near-infrared imaging in regions of high extinction and stellar crowding, and the substantial gain in sensitivity and resolution achieved with JWST. |
All Tables
All Figures
|
Fig. 1. Photometric calibration for the F090W (top), F200W (middle), and F444W (bottom) bands. Matched sources are shown as faint red dots. The subset of point-like sources (eccentricity < 0.01) used for calibration is indicated by red circles. Blue circles with error bars represent bin-averaged values computed via the bin-scatter method. The lower inset zooms into the region used for regression, delimited by dashed lines. Horizontal dashed lines indicate the linear fits used to compute the final magnitude offsets. |
| In the text | |
|
Fig. 2. Completeness as a function of apparent magnitude in the F444W band. The blue curve shows the recovery fraction of 5000 injected synthetic galaxies, with shaded regions indicating the 95% confidence interval derived from binomial statistics. Horizontal dashed lines mark the 80% and 50% completeness thresholds. The inset shows the magnitude distribution of the injected sources, sampled from a beta distribution to mimic the shape of the observed luminosity function. |
| In the text | |
|
Fig. 3. Parameter space used to distinguish point-like from extended sources. Blue dots represent all detections in the field, while red circles indicate sources matched with Gaia stars. Vertical and horizontal lines mark the third quartile of the distributions in FWHM and SNR_WIN, respectively. |
| In the text | |
|
Fig. 4. Mutual information matrix of the morphometric parameters. The color intensity reflects the degree of statistical dependence, from 0 (independent) to 1 (fully dependent). |
| In the text | |
|
Fig. 5. Box plot summary of CLASS_STAR, ELLIPTICITY, ECCENTRICITY, and ISOAREA_IMAGE across the four sectors. Orange notches mark median values. Outliers are shown as open circles. Color codes correspond to sector classification as described in the text. |
| In the text | |
|
Fig. 6. Projected positions of the 102 galaxies detected in the JWST/NIRCam observations of NGC 3324, shown in native detector coordinates. The marker color encodes the F444W_AUTO magnitude (darker tones correspond to brighter sources), and the marker size scales with the isophotal area (ISOAREA_IMAGE) in pixel units. The black line outlines the approximate boundary of the high-extinction region associated with the molecular cloud. A size reference for ISOAREA_IMAGE is included in the legend. The mosaic covers a field of view of 7.38′×4.23′ (∼31 arcmin2). This figure provides a visual reference for the spatial distribution of the detected galaxies across the field. |
| In the text | |
|
Fig. 7. Distribution of apparent magnitudes (F444W_AUTO) for the galaxies detected in our study. Vertical ticks above the histogram indicate the magnitude of each galaxy. Two insets display the brightest and faintest galaxies in the sample, providing visual references for the boundaries of the detected population. All magnitudes were measured using the Gaussian-weighted WIN aperture in the F444W band. |
| In the text | |
|
Fig. 8. Composite near-infrared view of the NGC 3324 region as observed by JWST/NIRCam. The color image was constructed using the F090W (blue), F200W (green), and F444W (red) filters. The central panel displays the full field, revealing complex filamentary structures of ionized gas and embedded stars. The top and bottom rows show the eight brightest galaxies identified in the field, extracted from the same composite image and labeled 1 through 8 from the top left to bottom right. Each stamp contains a white square of 5″ × 5″ drawn for spatial reference. The figure is oriented in detector-native X/Y coordinates; north is rotated 102° counterclockwise from vertical. |
| In the text | |
|
Fig. 9. Composite red-green-blue image of the eastern region of the field showing a compact overdensity of seven galaxies (dashed boxes) identified within a radius of 17″ centered at (RA, Dec) = (159.2840°, −58.5948°). The image combines F200W, F335M, and F444W filters. The bright vertical feature corresponds to a diffraction spike from a saturated star. The bright galaxy along a diffraction spike corresponds to Galaxy 4 (see Sect. 5) and is not considered in the analysis. The figure is oriented in detector-native X/Y coordinates; north is rotated 102° counterclockwise from vertical. |
| In the text | |
|
Fig. 10. Magnitude distributions for JWST/NIRCam F200W, VISTA/VIRCAM Ks, and 2MASS Ks sources in the NGC 3324 field. Boxes show interquartile ranges with notched medians, and insets display the normalized transmission curves and effective wavelengths of each filter. |
| In the text | |
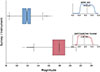 |
Fig. 11. Same as Fig. 10 but for JWST/NIRCam F444W and WISE/W2 sources in the NGC 3324 field. |
| In the text | |
|
Fig. A.1. Mosaic of all 102 galaxies detected in the field from the F444W reference image (see Sect. 3.1). Each stamp measures 3″ × 3″. The galaxies are arranged in order of decreasing brightness, from the brightest object in the upper-left corner to the faintest in the lower-right corner. The figure highlights the morphological diversity of the sample, including edge-on disks, spheroidal systems, and irregular galaxies. |
| In the text | |
|
Fig. B.1. Composite near-infrared view of the NGC 3324 region as observed by the VVVX survey. The field corresponds to tile e1084, observed on March 19, 2018, and fully covered in the J, H, and Ks bands. Despite being located within the nominal depth of the survey, no galaxies were included in the VVV–NIRGC catalogs. The central panel displays the same field shown in Fig. 8, preserving its orientation to enable a direct comparison with the JWST/NIRCam image. The top and bottom rows show the eight brightest galaxies (1–8) identified in the JWST image, placed at their corresponding sky positions within the VVVX frame. Each stamp contains a white 5″ × 5″ box for spatial reference. North is rotated 102° counterclockwise from vertical, matching the orientation adopted in Fig. 8. This comparison highlights the observational limitations of ground-based near-infrared imaging in regions of high extinction and stellar crowding, and the substantial gain in sensitivity and resolution achieved with JWST. |
| In the text | |
Current usage metrics show cumulative count of Article Views (full-text article views including HTML views, PDF and ePub downloads, according to the available data) and Abstracts Views on Vision4Press platform.
Data correspond to usage on the plateform after 2015. The current usage metrics is available 48-96 hours after online publication and is updated daily on week days.
Initial download of the metrics may take a while.