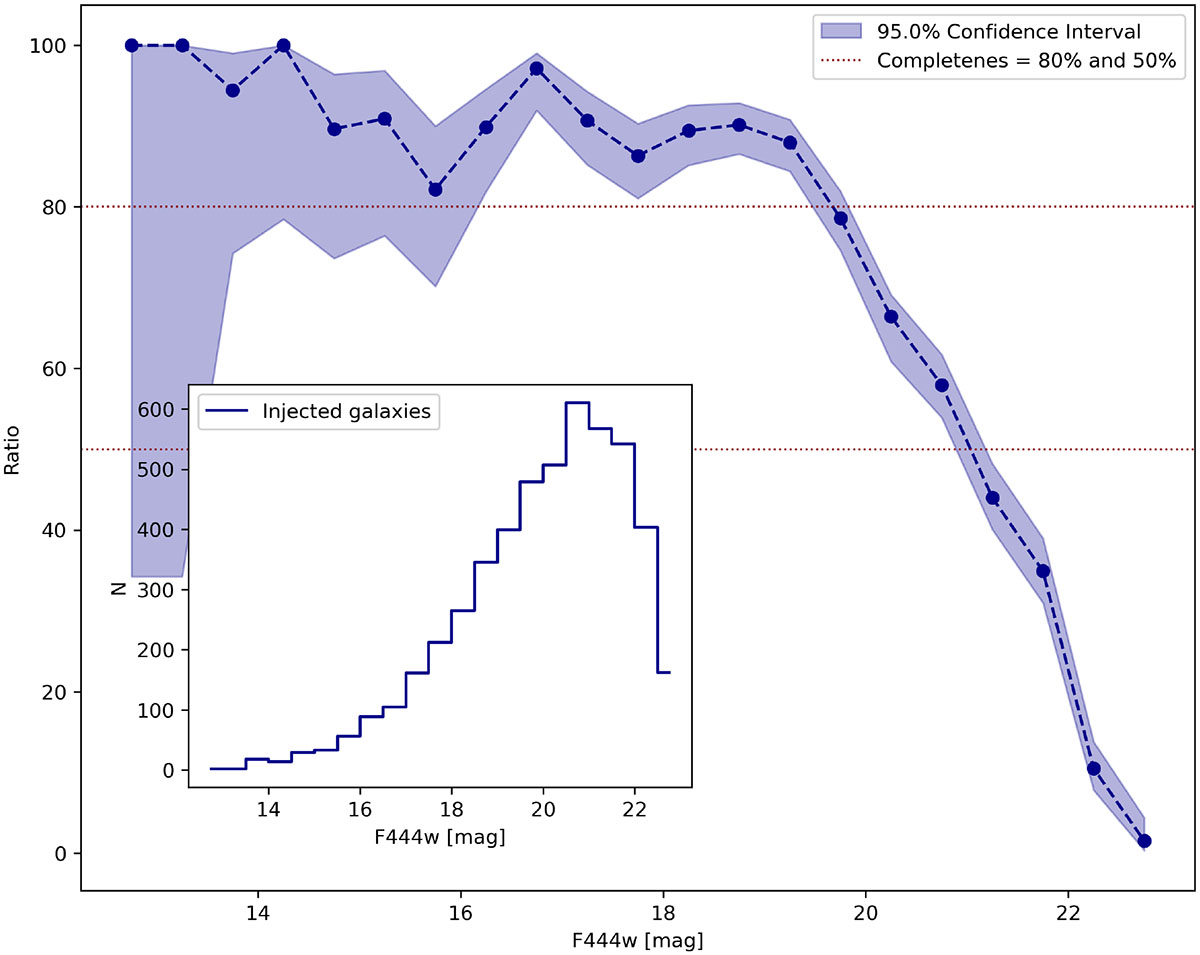
Fig. 2.
Download original image
Completeness as a function of apparent magnitude in the F444W band. The blue curve shows the recovery fraction of 5000 injected synthetic galaxies, with shaded regions indicating the 95% confidence interval derived from binomial statistics. Horizontal dashed lines mark the 80% and 50% completeness thresholds. The inset shows the magnitude distribution of the injected sources, sampled from a beta distribution to mimic the shape of the observed luminosity function.
Current usage metrics show cumulative count of Article Views (full-text article views including HTML views, PDF and ePub downloads, according to the available data) and Abstracts Views on Vision4Press platform.
Data correspond to usage on the plateform after 2015. The current usage metrics is available 48-96 hours after online publication and is updated daily on week days.
Initial download of the metrics may take a while.