Fig. 1.
Download original image
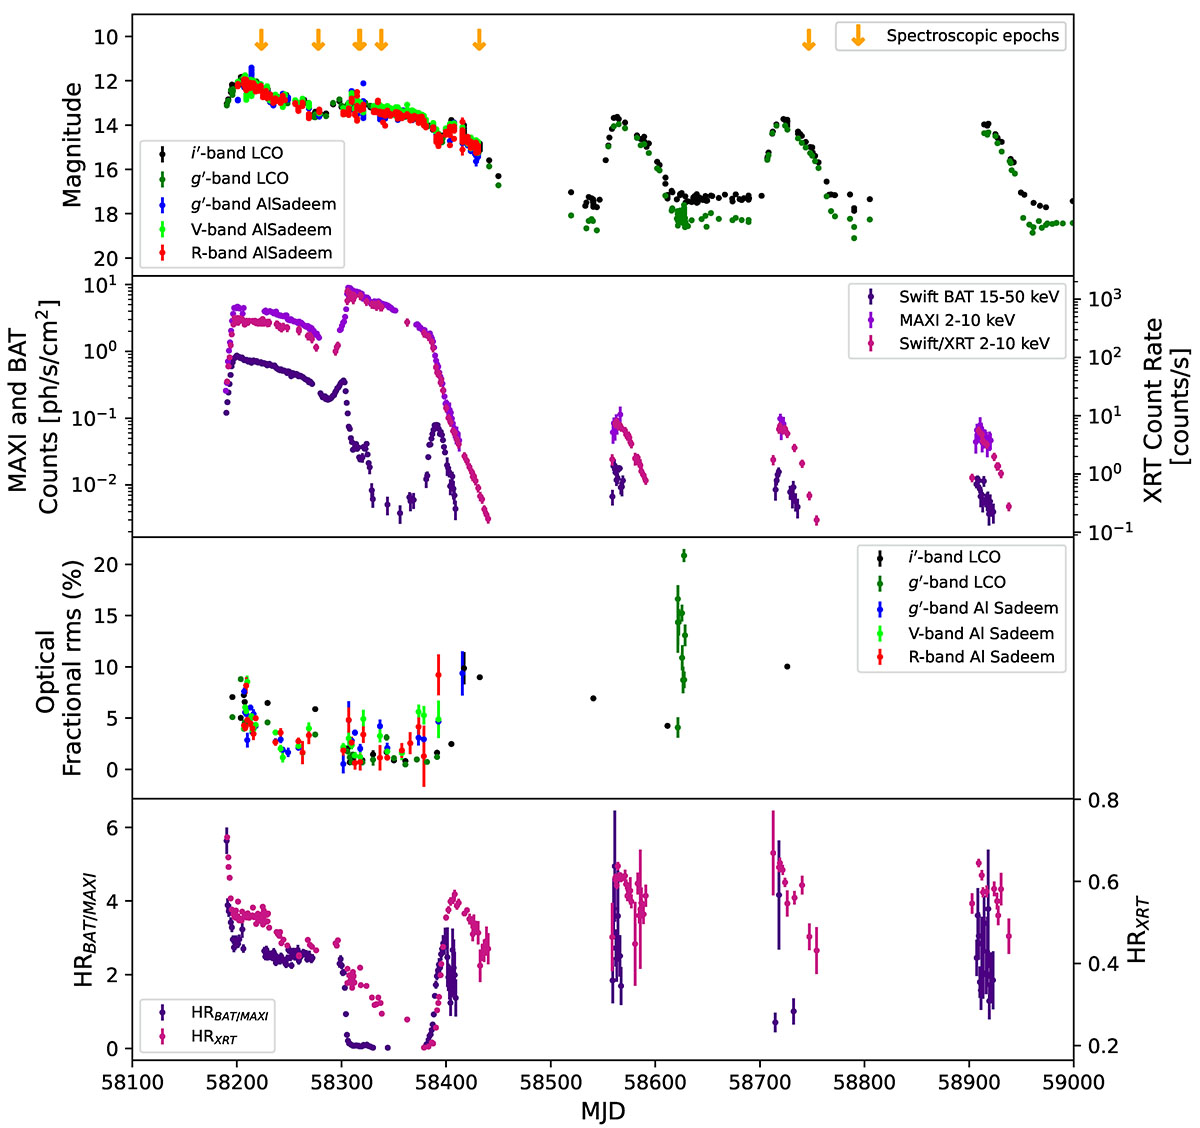
First panel: optical LCO (g′ and i′) and Al Sadeem (g′, V, and R) light curves of MAXI J1820+070 during its 2018-2019 outburst. Magnitudes are not corrected for reddening. Second panel: Swift/BAT (purple), Swift/XRT (pink), and MAXI/GSC (dark purple) count rates vs MJD. Swift/BAT counts have been divided by 100 for visualisation purposes. Third panel: MJD vs. fractional rms variability amplitude evaluated for the time-resolved optical light curves obtained with the LCO and Al Sadeem observations. Fourth panel: MJD vs. hardness ratio evaluated as BAT/MAXI count rates (HRBAT/MAXI) and XRT (2–10 keV)/XRT (0.5–2 keV) count rates (HRXRT). The first panel is available at the CDS.
Current usage metrics show cumulative count of Article Views (full-text article views including HTML views, PDF and ePub downloads, according to the available data) and Abstracts Views on Vision4Press platform.
Data correspond to usage on the plateform after 2015. The current usage metrics is available 48-96 hours after online publication and is updated daily on week days.
Initial download of the metrics may take a while.