Fig. A.1.
Download original image
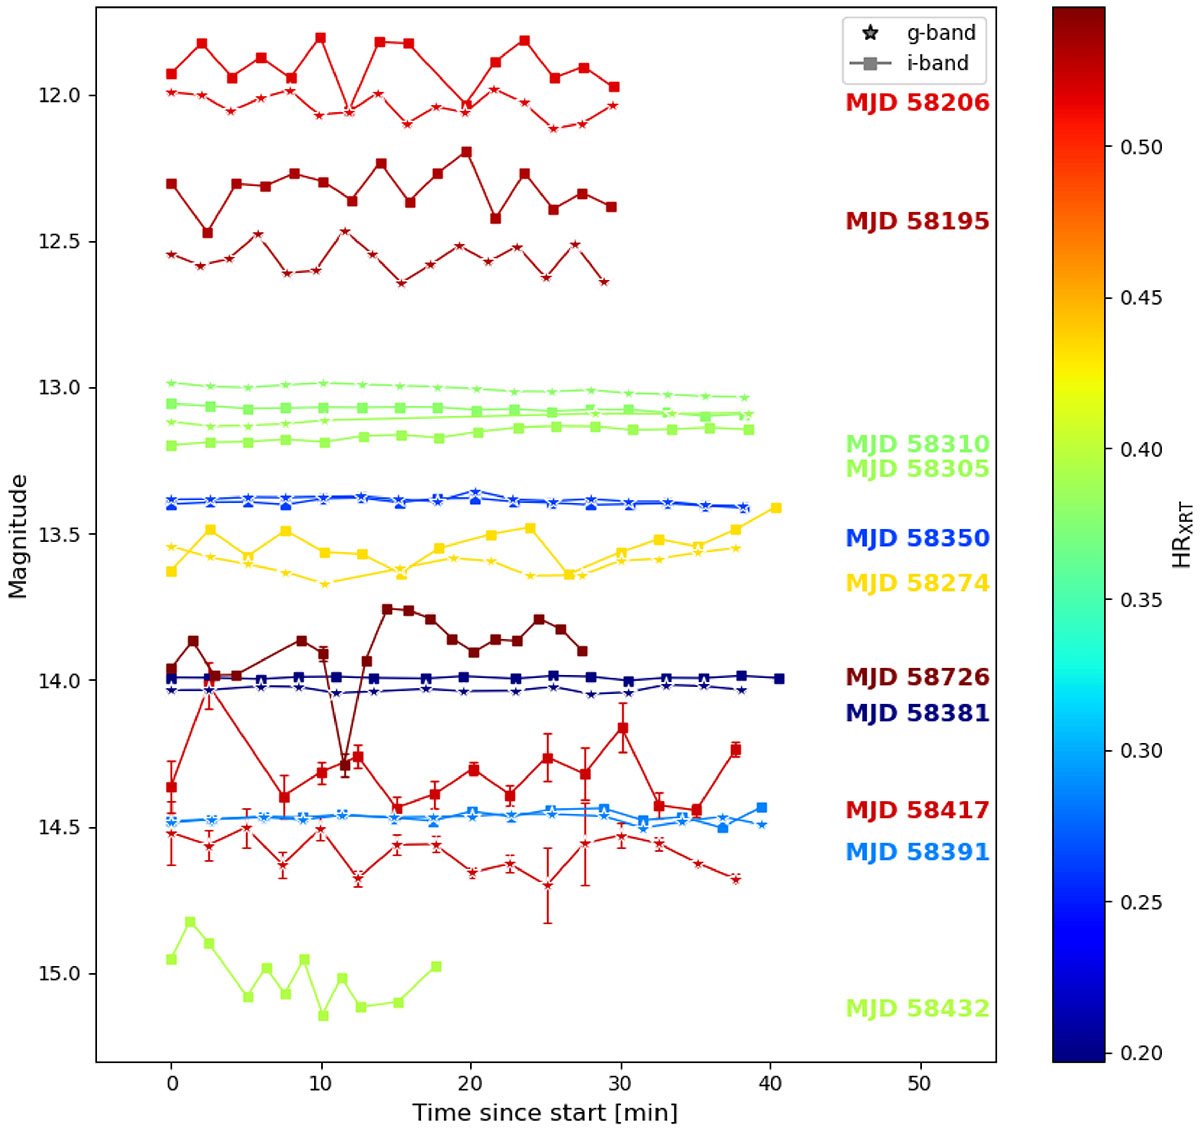
Selection of short-timescale light curves of MAXI J1820+070 from the campaign presented in this work. The X-ray spectral hardness is colour-coded, as indicated by the colour bar (red is hard, blue is soft). The g′- and i′-band light curves are shown as stars and squares, respectively. Time is measured in minutes since the start of each light curve.
Current usage metrics show cumulative count of Article Views (full-text article views including HTML views, PDF and ePub downloads, according to the available data) and Abstracts Views on Vision4Press platform.
Data correspond to usage on the plateform after 2015. The current usage metrics is available 48-96 hours after online publication and is updated daily on week days.
Initial download of the metrics may take a while.