Fig. B.1.
Download original image
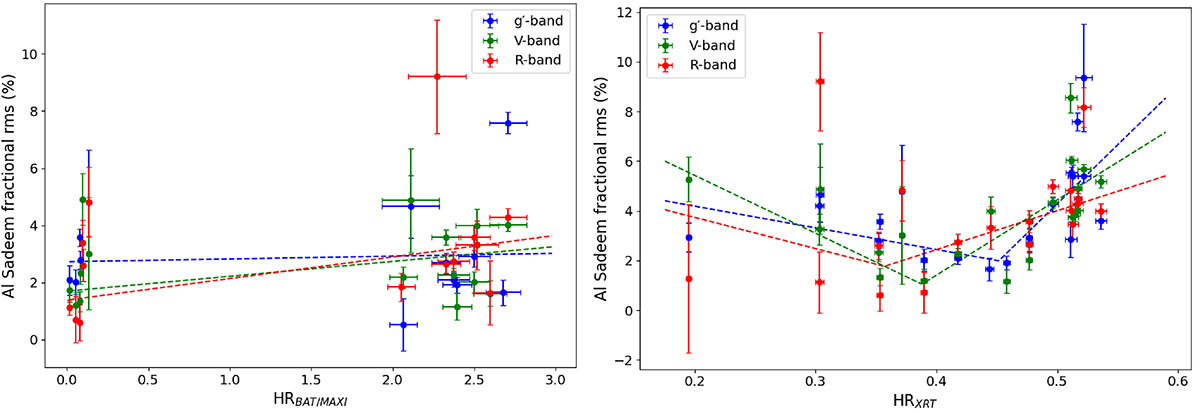
Top: Fractional rms vs hardness ratio calculated as the BAT flux/MAXI flux and the optical fluxes obtained at the Al Sadeem Observatory in the g′, V, and R bands (blue, green, and red points, respectively). Linear fits are represented with colour-coded dashed lines. Results of the fits are reported in Table 1. Bottom: Fractional rms vs hardness ratio calculated as the 2-10 keV Swift/XRT flux / the 0.5-2 keV Swift/XRT flux and the optical fluxes obtained at the Al Sadeem Observatory in the g′, V, and R bands. Results of the fits are reported in Table 2.
Current usage metrics show cumulative count of Article Views (full-text article views including HTML views, PDF and ePub downloads, according to the available data) and Abstracts Views on Vision4Press platform.
Data correspond to usage on the plateform after 2015. The current usage metrics is available 48-96 hours after online publication and is updated daily on week days.
Initial download of the metrics may take a while.