Fig. C.1.
Download original image
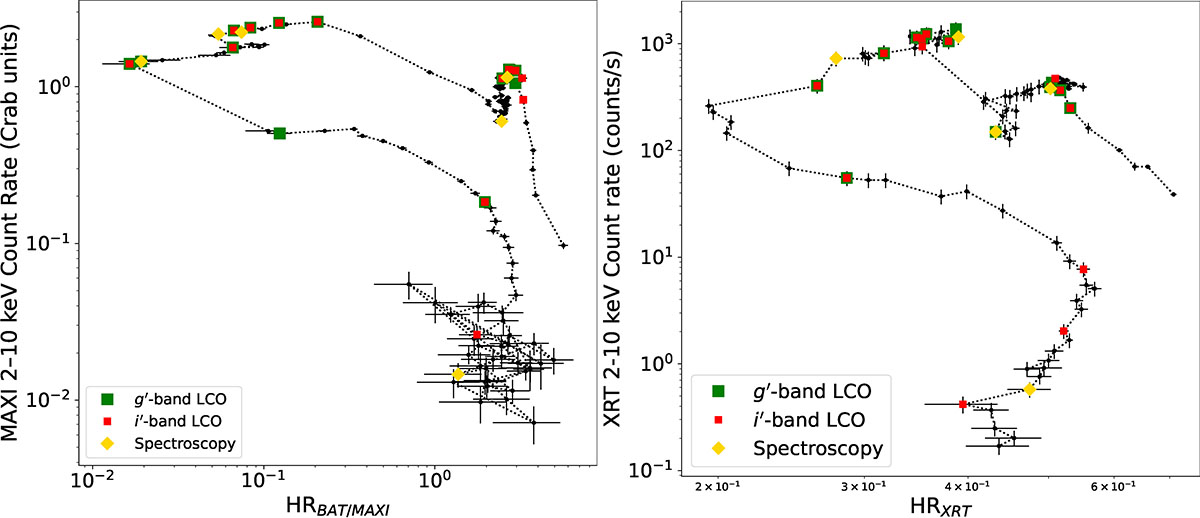
HID of MAXI J1820+070 during its main 2018 outburst, constructed using HRBAT/MAXI (left) and HRXRT (right) as hardness ratios. Squares indicate epochs where nearly simultaneous (within one day) fractional rms variability amplitudes and hardness ratio estimates were obtained in the g′ (green) and i′ (red) LCO bands. For clarity, the Al Sadeem time-resolved epochs are not shown. Yellow diamonds mark the epochs of the spectroscopic campaign during the main outburst (Sect. 6 and Appendix D), with each point corresponding to the closest hardness ratio measurement to the spectroscopic observation.
Current usage metrics show cumulative count of Article Views (full-text article views including HTML views, PDF and ePub downloads, according to the available data) and Abstracts Views on Vision4Press platform.
Data correspond to usage on the plateform after 2015. The current usage metrics is available 48-96 hours after online publication and is updated daily on week days.
Initial download of the metrics may take a while.