Open Access
Fig. D.1.
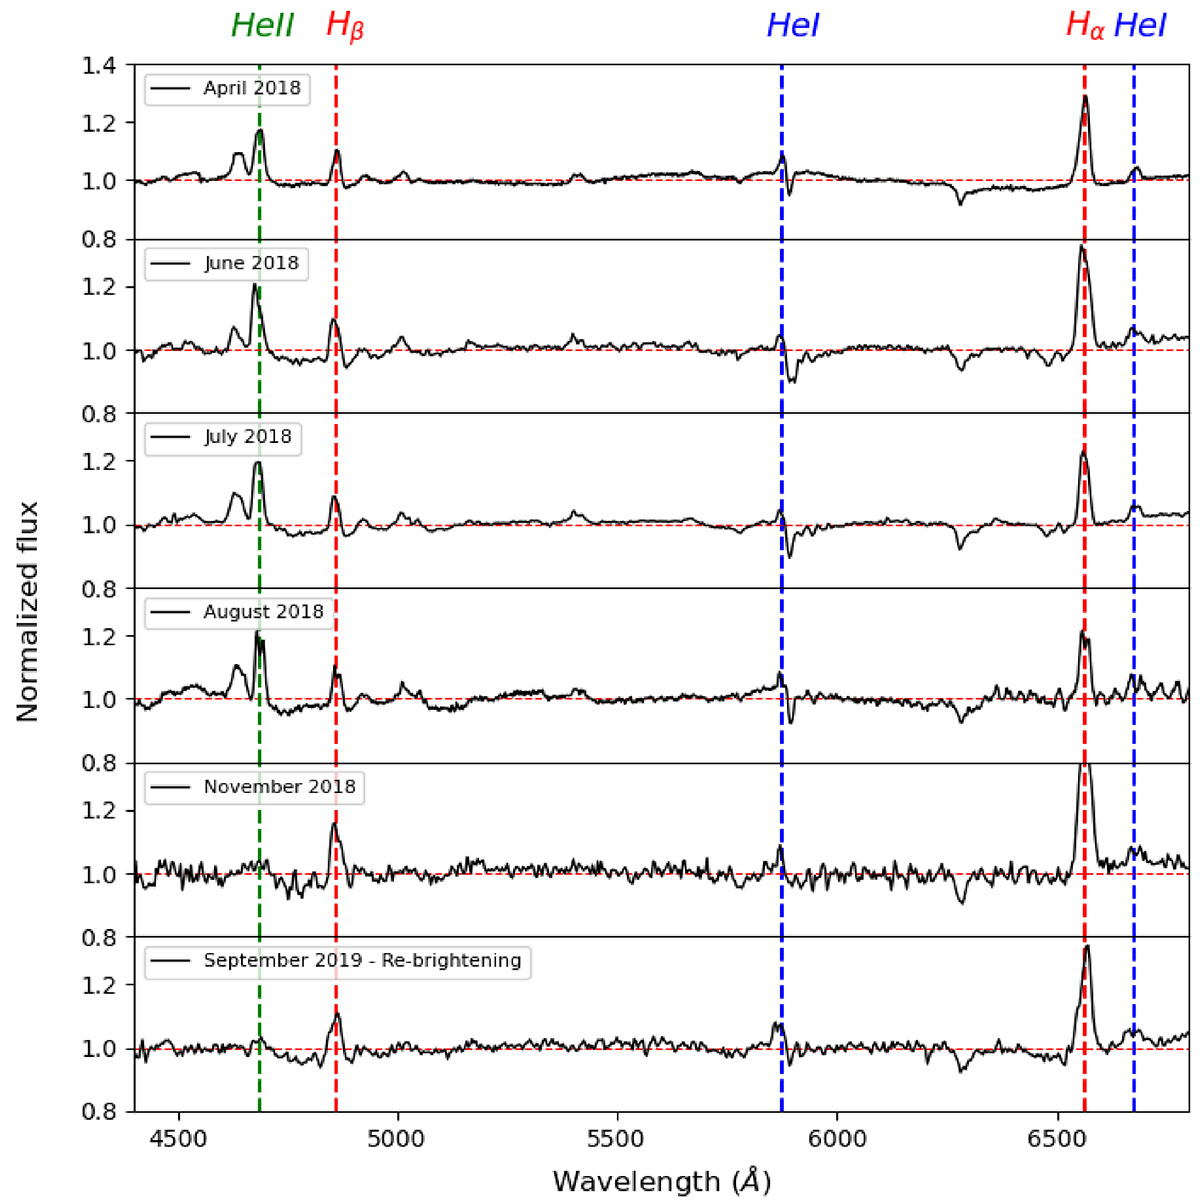
Download original image
Averaged spectra collected in the six different epochs reported in this work (Table D.1). The positions of the most prominent He II, H, and He I emission lines are shown with vertical dashed green, red, and blue lines, respectively. A horizontal dashed red line marks where the normalised flux is equal to 1 in each panel.
Current usage metrics show cumulative count of Article Views (full-text article views including HTML views, PDF and ePub downloads, according to the available data) and Abstracts Views on Vision4Press platform.
Data correspond to usage on the plateform after 2015. The current usage metrics is available 48-96 hours after online publication and is updated daily on week days.
Initial download of the metrics may take a while.