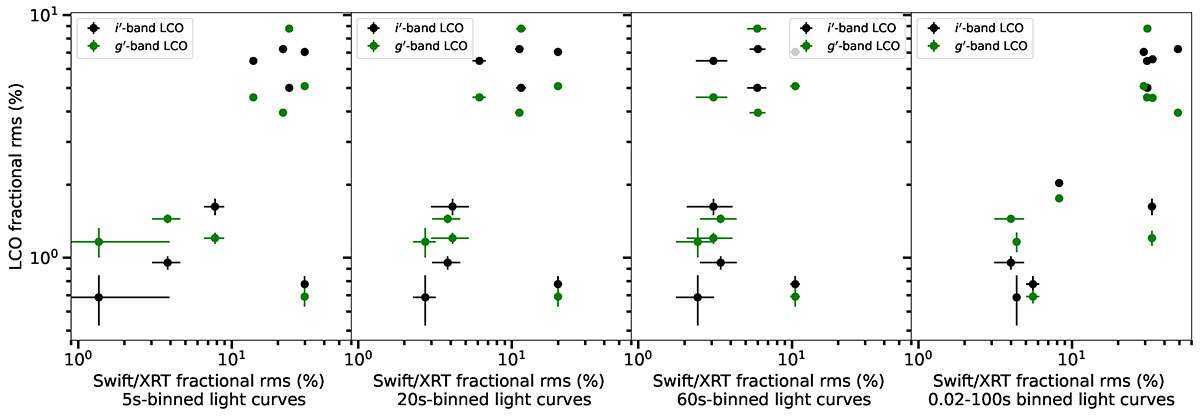
Fig. 4.
Download original image
Fractional rms of the optical LCO g′ (green dots) and i′ (black dots) data vs. the Swift/XRT fractional rms amplitude (%) in the 2.0−10.0 keV energy band. The first three panels show the Swift/XRT rms obtained from 5 s-, 20 s-, and 60 s-binned light curves, respectively. The rightmost panel shows the Swift/XRT broadband-frequency rms 0.01−64 Hz (i.e. 0.02–100 s) on the x-axis. Horizontal and vertical error bars represent one-sigma uncertainties calculated analytically for each respective method.
Current usage metrics show cumulative count of Article Views (full-text article views including HTML views, PDF and ePub downloads, according to the available data) and Abstracts Views on Vision4Press platform.
Data correspond to usage on the plateform after 2015. The current usage metrics is available 48-96 hours after online publication and is updated daily on week days.
Initial download of the metrics may take a while.