Fig. 6.
Download original image
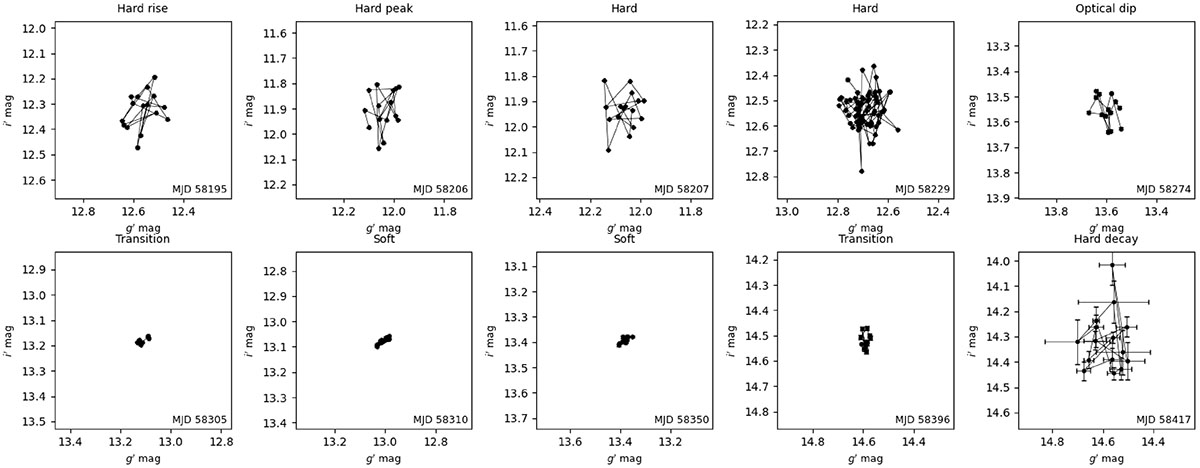
Short-timescale magnitude–magnitude diagrams for MAXI J1820+070 across different phases of its outburst. Each panel shows g′ vs. i′ magnitudes for a specific MJD (indicated in the lower-right corner), with point-to-point connections highlighting the light curve evolution. The different phases of the outburst are indicated on top of each panel, reflecting the spectral state inferred from simultaneous X-ray monitoring.
Current usage metrics show cumulative count of Article Views (full-text article views including HTML views, PDF and ePub downloads, according to the available data) and Abstracts Views on Vision4Press platform.
Data correspond to usage on the plateform after 2015. The current usage metrics is available 48-96 hours after online publication and is updated daily on week days.
Initial download of the metrics may take a while.