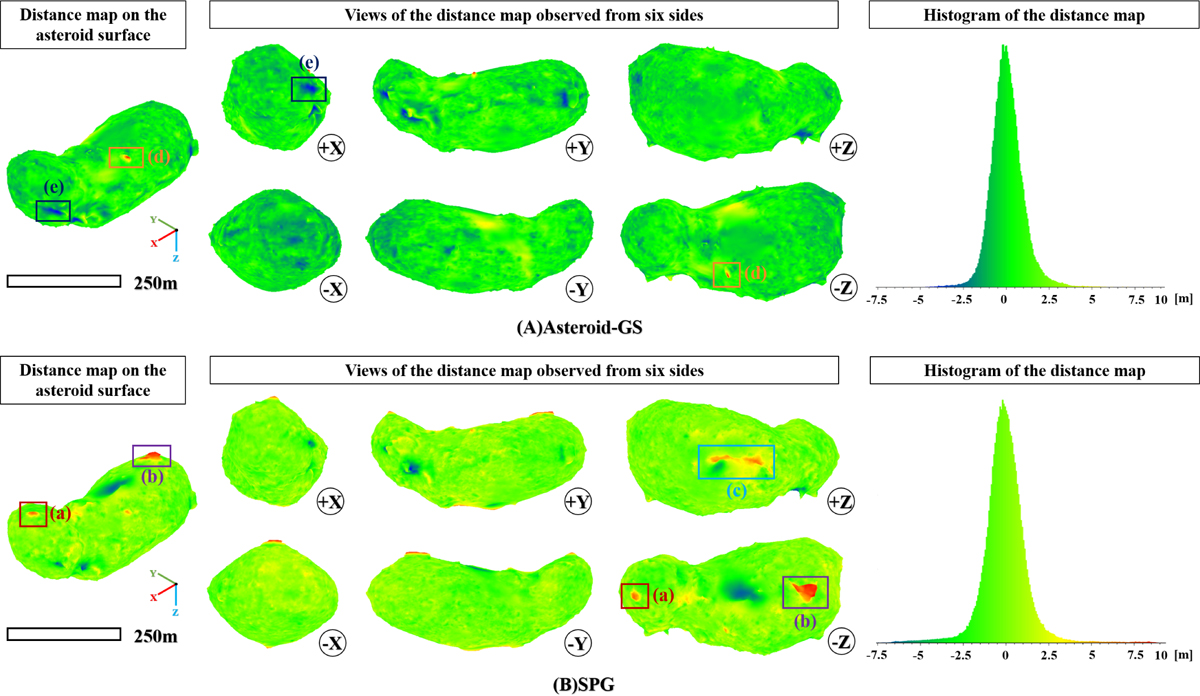
Fig. 9
Download original image
Visualization of distance maps relative to the reference model for our Asteroid-GS method and the SPG method on asteroid Itokawa (25143). Views observed from six directions (+x, -x, +y, -y, + z, -z) comprehensively highlight the differences. The histograms of the distance maps on the right illustrate the statistical distribution of distances. Compared to the SPG method, which exhibits a broader distribution with deviations up to nearly 10 meters, our proposed Asteroid-GS method achieves a more concentrated distribution within 5 meters.
Current usage metrics show cumulative count of Article Views (full-text article views including HTML views, PDF and ePub downloads, according to the available data) and Abstracts Views on Vision4Press platform.
Data correspond to usage on the plateform after 2015. The current usage metrics is available 48-96 hours after online publication and is updated daily on week days.
Initial download of the metrics may take a while.