Fig. 1
Download original image
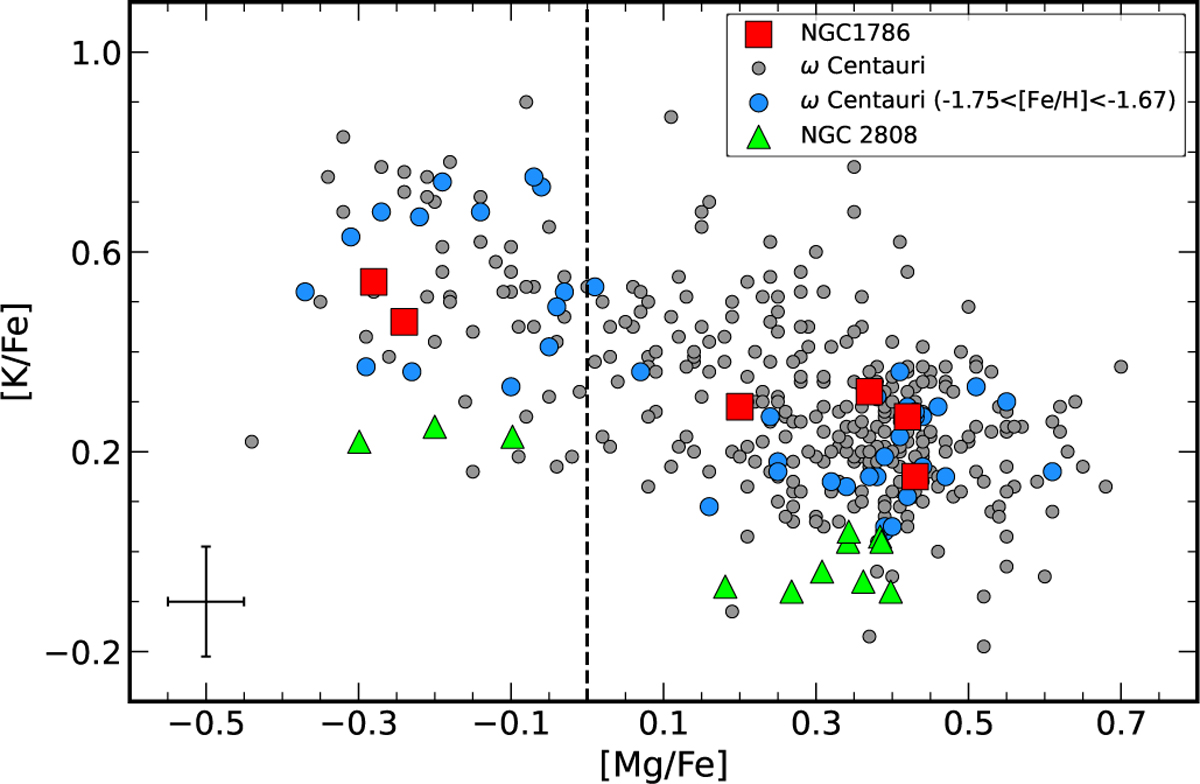
Run of [K/Fe] as a function of [Mg/Fe] for the six stars of NGC 1786 here analyzed (red squares). As a comparison, the same trend is plotted for the stars belonging to ω Centauri (gray and blue circles; Alvarez Garay et al. 2022) and to NGC 2808 (green triangles; Mucciarelli et al. 2015). The blue circles represent the stars of ω Cen-tauri in the same metallicity range as NGC 1786. The vertical dashed line splits the Mg-poor and Mg-rich stars. The error bar in the bottom-left corner represents the typical error associated with the abundance ratios.
Current usage metrics show cumulative count of Article Views (full-text article views including HTML views, PDF and ePub downloads, according to the available data) and Abstracts Views on Vision4Press platform.
Data correspond to usage on the plateform after 2015. The current usage metrics is available 48-96 hours after online publication and is updated daily on week days.
Initial download of the metrics may take a while.