Fig. 2
Download original image
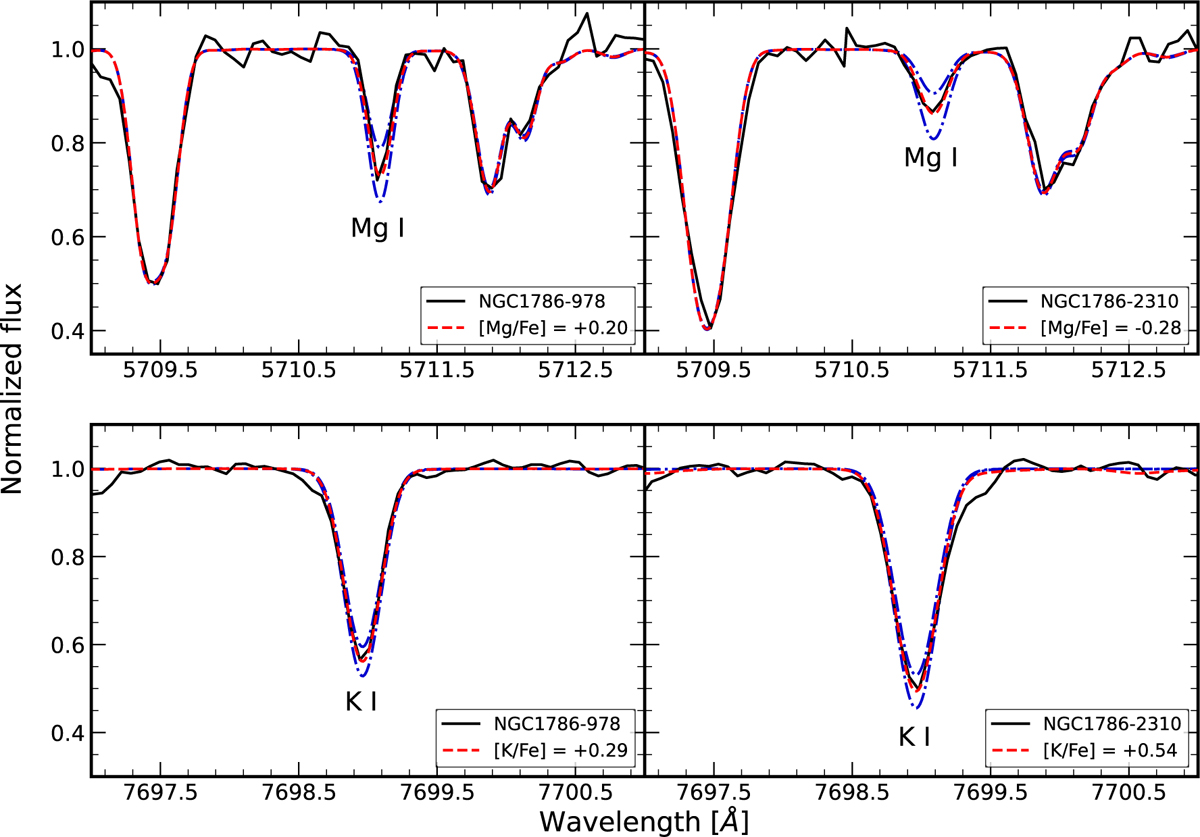
Comparison between the spectra of NGC1786-978 (left panels) and NGC1786-2310 (right panels) around the Mg line at 5711 Å (upper panels) and the K line at 7699 Å (lower panels). The solid black lines represent the observed spectra, the solid red lines the best-fit synthetic spectra, and the dash-dotted blue lines the synthetic spectra with the abundances varied by ±0.2 dex with respect to the best values. In the bottom-right corners are the names of the stars and the corresponding [Mg/Fe] and [K/Fe] abundance ratios.
Current usage metrics show cumulative count of Article Views (full-text article views including HTML views, PDF and ePub downloads, according to the available data) and Abstracts Views on Vision4Press platform.
Data correspond to usage on the plateform after 2015. The current usage metrics is available 48-96 hours after online publication and is updated daily on week days.
Initial download of the metrics may take a while.