Open Access
Fig. 12
Download original image
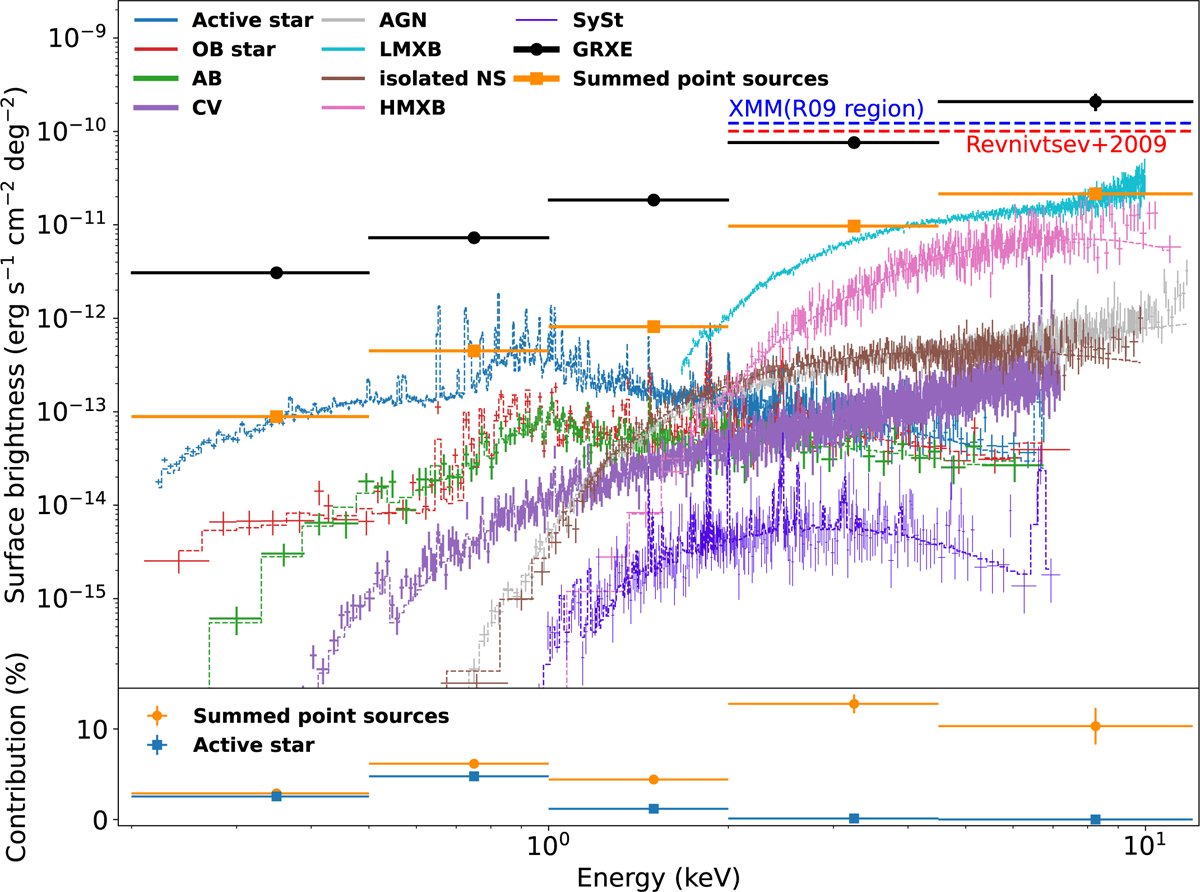
Stacked X-ray spectra of classified source populations from the eRASS1 sample (colored lines), compared to the GRXE surface brightness (black points) in five broad energy bands. The summed spectrum of all classified point sources is shown as orange squares.
Current usage metrics show cumulative count of Article Views (full-text article views including HTML views, PDF and ePub downloads, according to the available data) and Abstracts Views on Vision4Press platform.
Data correspond to usage on the plateform after 2015. The current usage metrics is available 48-96 hours after online publication and is updated daily on week days.
Initial download of the metrics may take a while.