| Issue |
A&A
Volume 704, December 2025
|
|
|---|---|---|
| Article Number | A107 | |
| Number of page(s) | 15 | |
| Section | Galactic structure, stellar clusters and populations | |
| DOI | https://doi.org/10.1051/0004-6361/202556747 | |
| Published online | 08 December 2025 | |
Unveiling the soft X-ray source population toward the inner Galactic disk with XMM-Newton
1
INAF – Osservatorio Astronomico di Brera, Via E. Bianchi 46, 23807 Merate, Italy
2
Max-Planck-Institut für Extraterrestriche Physik, Gießenbachstraße 1, 85748 Garching, Germany
3
Como Lake Center for Astrophysics (CLAP), DiSAT, Università degli Studi dell’Insubria, via Valleggio 11, 22100 Como, Italy
4
Department of Astronomy, University of Illinois, 1002 W. Green St., Urbana, IL 61801, USA
5
Department of Physics and Astronomy, University of California, Los Angeles, CA 90095-1547, USA
6
Columbia Astrophysics Laboratory, Columbia University, New York, NY 10027, USA
7
School of Astronomy and Space Science, Nanjing University, Nanjing 210046, China
★ Corresponding author: This email address is being protected from spambots. You need JavaScript enabled to view it.
Received:
4
August
2025
Accepted:
26
October
2025
Abstract
Context. Across the Galactic disk lies a diverse population of X-ray sources, including coronally active stars and accreting compact objects. While high-luminosity sources are well characterized, the fainter end of the population remains poorly understood due to sensitivity limitations in previous X-ray surveys.
Aims. We aim to classify and characterize faint X-ray sources detected in the eROSITA All-Sky Survey (eRASS1) toward the inner Galactic disk using deeper XMM-Newton observations. By combining X-ray spectral analysis with Gaia counterparts, we assessed the representativeness of the eRASS1 catalog for the broader Galactic X-ray population.
Methods. We analyzed 189 eRASS1 X-ray sources toward the inner Galactic disk using deep XMM-Newton observations (typical exposure of 20 ks) that cover the region 350° < l < 360° and −1° < b < 1°. Source classification was carried out by combining X-ray spectral fitting in the 0.2-10 keV band with Gaia astrometric and photometric data.
Results. Approximately 74% of X-ray sources detected by eROSITA toward the inner Galactic disk are coronal sources (primarily active stars and binaries), while 8% are wind-powered massive stars and 18% are accreting compact objects. We propose an empirical hardness-ratio cut (HR > -0.2, with HR defined using the 0.5-2 and 2-8 keV bands) to efficiently identify non-coronal sources within the eRASS1 catalog. By stacking classified sources and comparing with the Galactic ridge X-ray emission (GRXE), we estimate that ~6% of the GRXE flux can be resolved into point sources in the 0.5-2.0 keV band above the eRASS1 flux limit of ~5× 10⁻¹⁴ erg cm−2 s−1, with soft-band emission dominated by active stars and hard-band flux primarily from X-ray binaries.
Conclusions. Our results demonstrate that the eRASS1 catalog toward the inner Galactic disk is dominated by coronal sources but retains a non-negligible population of massive stars and accreting compact objects that can be effectively identified with X-ray color selection.
Key words: novae, cataclysmic variables / Galaxy: disk / Galaxy: stellar content / X-rays: binaries / X-rays: stars
© The Authors 2025
 Open Access article, published by EDP Sciences, under the terms of the Creative Commons Attribution License (https://creativecommons.org/licenses/by/4.0), which permits unrestricted use, distribution, and reproduction in any medium, provided the original work is properly cited.
This article is published in open access under the Subscribe to Open model. This email address is being protected from spambots. You need JavaScript enabled to view it. to support open access publication.
1 Introduction
The study of Galactic X-ray sources has advanced significantly since the early all-sky surveys conducted by missions such as HEAO-1 and ROSAT, which revealed that the most luminous X-ray sources in the Milky Way are primarily X-ray binaries (XRBs) and supernova remnants (Ambruster & Wood 1986; Truemper 1993). These objects dominate the high-flux end of the X-ray sky, and their nature has been thoroughly characterized through follow-up multiwavelength identification programs.
While the high-luminosity end of the X-ray source population is now relatively well understood, many different classes of fainter sources contribute to the Galactic X-ray landscape (Sazonov et al. 2006). The population of low- to intermediateluminosity X-ray sources (typically defined as LX ≲ 1034 erg s−1) remains far less explored, with our current knowledge largely limited to nearby representatives in the solar neighborhood (Pretorius & Knigge 2012; Pretorius et al. 2013; Pala et al. 2020). These fainter sources, comprising cataclysmic variables (CVs), active binaries (ABs), and even some quiescent XRBs, are believed to represent the dominant contributors to the so-called Galactic ridge X-ray emission (GRXE), a diffuse X-ray emission concentrated toward the Galactic plane (Worrall & Marshall 1983; Revnivtsev et al. 2006, 2009; Hong et al. 2012; Reis et al. 2013; Muno et al. 2004). The Galactic disk, which harbors a complex mixture of stellar populations, star-forming regions, and a dense interstellar medium, presents an ideal laboratory for studying these faint X-ray emitters (Degenaar et al. 2012; Ponti et al. 2015; Hong et al. 2016; Wang 2021).
The early ROSAT all-sky maps revealed a broad soft X-ray distribution (1.5 keV) across the Galactic disk. After that, ASCA observations of the Galactic plane detected ∼0.8 keV ionized plasma in the GRXE spectra (Kaneda et al. 1997; Tanaka 2002), and the harder component (kT ∼ 7 keV) is generally associated with accreting binaries including CVs, as revealed by subsequent X-ray surveys (Muno et al. 2004; Revnivtsev et al. 2009; Morihana et al. 2013; Yamamoto et al. 2023).
Deep Chandra observations of the Galactic center, bulge, and plane have resolved a significant fraction of the broadband (2-10 keV) GRXE into discrete sources, particularly the Fe line emission at ∼6-7 keV (Revnivtsev et al. 2009). In contrast, the origin of the softer thermal emission (below ∼2 keV) remains less well constrained. As suggested by early XMM Galactic Plane Survey results (Hands et al. 2004), it is likely dominated by nearby, low-luminosity sources, whose contributions have not yet been systematically quantified.
The advent of the eROSITA (extended Roentgen Survey with an Imaging Telescope Array) mission has revolutionized X-ray astronomy with its unprecedented all-sky coverage and improved sensitivity (Merloni et al. 2012; Sunyaev et al. 2021). The eROSITA All-Sky Survey (eRASS1; Merloni et al. 2024) has detected a large number of X-ray sources in the Galactic plane, significantly increasing the known population. However, despite its wide coverage, eROSITA’s relatively shallow depth and limited spatial resolution in dense Galactic fields can lead to source confusion and difficulties in obtaining detailed spectral information for fainter detections. This often leaves the precise nature of many eRASS1 sources in these complex regions ambiguous, hindering a complete census and characterization of the faint X-ray population.
Our ongoing XMM-Newton Heritage Survey of the Galactic Plane was designed to uniformly cover the Galactic plane region (350° < l < 7°, |b| < 1°) with ∼20 ks exposures, achieving an order-of-magnitude improvement in sensitivity compared to eROSITA. The deeper exposures provided by XMM-Newton allow the detection and characterization of fainter sources below the eRASS1 detection limit and, crucially, enable the extraction of high-quality X-ray spectra for sources detected by both missions. These detailed spectra provide vital diagnostic information (e.g., plasma temperature, absorption, and the presence of emission lines) often unavailable from eROSITA data alone. In this work, we focused on characterizing the eRASS1 flux-limited sample in combination with deep XMM-Newton observations and detailed multiwavelength classifications. This allowed us to dissect the observed soft-band GRXE into contributions from distinct source populations.
Here we present a comprehensive study of the soft X-ray source population toward the inner Galactic disk, focusing on the sources detected by both eROSITA and XMM-Newton. By combining X-ray spectral analysis and Gaia Data Release 3 (DR3) astrometry and photometry, we aim to (1) classify the nature of faint Galactic X-ray sources; (2) validate empirical classification schemes based on eROSITA observables; and (3) quantify the contribution of resolved stellar sources to the observed GRXE. The paper is organized as follows: Section 2 describes the construction of our X-ray source catalog and the XMM-eROSITA cross-matching. Section 3 details the identification of Gaia counterparts and the reliability of the classification done via the HamStar method (Freund et al. 2024). In Sect. 4, we outline the X-ray data reduction and spectral analysis. Source classification based on multiwavelength diagnostics is presented in Sect. 5. In Sect. 6, we propose a simple empirical hardness ratio (HR) cut to select accreting compact objects from the eROSITA Galactic plane catalog, and assess the contributions of various resolved source classes to the GRXE spectra.
2 XMM-Newton observations and source catalog
We are in the process of completing the XMM-Newton Heritage survey toward the inner Galactic disk, which covers the disk region in the range of 350° < 1 < 7° and -1° < b < 1°. The average exposure is approximately 20 ks per tile, providing a factor of ∼10 improvement in sensitivity over eRASS1.
2.1 4XMM DR14s
We utilized the XMM-Newton Serendipitous Source Catalog from Stacked Observations (4XMM-DR14s; Traulsen et al. 2020). This catalog was constructed from simultaneous source detection on overlapping observations between 2001 and 2024, except for a 15′ region about the Galactic center, which was excluded from the processing for technical reasons. Of the 606 observations from our ongoing XMM-Newton Heritage Survey, 562 are included in this study. The remaining observations either were conducted after 2024 or are of the excluded Galactic center region. We applied rigorous quality cuts as follows:
STACK_FLAG ≤ 1 (minimizes stacked detection artifacts)
EP_DET_ML ≥ 6 (false-positive probability <0.1%)
EXTENT = 0 (include point sources only)
The final sample comprises 15 655 sources falling within the footprint of our XMM-Newton Heritage survey, where 9533 of them are observed by more than one observation. The observation data files were processed using the XMM-Newton Science Analysis System (SAS; v22.1.01). We used the task evselect to construct a high-energy background light curve - energy between 10 and 12 keV for EPIC-pn (Strüder et al. 2001) and above 10 keV for EPIC-MOS1/MOS2 (Turner et al. 2001) - by selecting only PATTERN==0. The background light curve was used to filter high-background flaring activity and to thereby identify good time intervals.
2.2 eRASS1 catalog
The eROSITA telescope array aboard the Spektrum Roentgen Gamma (SRG) satellite began surveying the sky in December 2019 (Predehl et al. 2021; Sunyaev et al. 2021). Here we utilized the eRASS1 catalog (Merloni et al. 2024), which contains sources located in the western Galactic hemisphere, using the data acquired in the first six months of survey operations (eRASS1; completed June 2020). We selected sources from the eRASS1 main catalog, which includes sources detected in the 0.2-2.3 keV band, with DET_LIKE_0 ≥ 10 and EXT_LIKE > 0 to reduce spurious detections lower than 1% and remove extended sources. In total, there are 182 sources left within the footprint of our XMM-Newton Heritage survey.
We also examined the eRASS1 Hard catalog (2.3-5 keV band) and identified 14 hard-band sources located within the sky coverage of our study. Among them, seven have “strong” associations, as defined in Merloni et al. (2024), and correspond to bright sources already included in our selected sample from the Main catalog. The remaining seven exhibit only “weak” or no associations. These are labeled as “hard-only” sources in the lower section of Table A.1. In total, 189 eRASS1 sources fall within the footprint of our XMM-Newton Heritage survey.
2.3 Cross-matching between eRASS1 and XMM sources
The positional uncertainty of X-ray sources is a crucial parameter for associating them with multiwavelength counterparts. We present the distribution of 1σ positional uncertainties for the selected 189 eRASS1 point sources. For comparison, we also show the 1σ positional uncertainties for the selected XMM sources from the 4XMM-DR14s catalog (Traulsen et al. 2020). The mean positional uncertainties for eRASS1 and XMM sources are ∼3.63" and ∼1.39", respectively, as shown in Fig. 1.
We further analyzed the angular separation between the eRASS1 sources and their nearest XMM counterparts. The resulting distribution shows a distinct bimodal structure with a break at around ∼16.3", corresponding to approximately 4.2σ of the combined positional uncertainties of the two catalogs. This separation threshold was adopted as a conservative criterion to ensure the inclusion of all likely true counterparts. As shown in Fig. 2, the bimodal distribution clearly distinguishes matched pairs from chance coincidences. Applying this separation threshold, we find that 158 of the 189 eRASS1 sources have counterparts in the XMM catalog, while the remaining 31 lack matches. Although the largest separations of our XMM-eRASS1 matches reach over 16.3″, we should note that only 5% (8 of 158) pairs have separations over 11.3", approximately 3σ of the combined mean positional uncertainties. For those eight sources, their positional errors are also larger than the mean positional uncertainties due to their faintness. Therefore, we included all 158 matched pairs in our selected sample.
As illustrated in Fig. 3, the 31 unmatched sources can be categorized as follows: Five of them appear to be extended sources that were misidentified as point sources; two of them lie in crowded regions (and hence may not be detected due to possible source confusion - i.e., multiple X-ray sources are detected as a single source by eROSITA); eight of them are located near the Galactic center or areas affected by stray light; and the remaining 16 are candidate transient sources. Hereafter we focus on the 158 sources with both XMM and eROSITA detections.
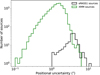 |
Fig. 1 Positional uncertainty comparison of eRASS1 and XMM-Newton sources. This histogram shows the 1σ positional uncertainties for sources in the eRASS1 (black) and XMM-Newton (green) catalogs. |
3 Gaia counterparts of eRASS1 sources
To enable a more robust classification of our X-ray sources, we cross-matched the 158 eRASS1 sources with optical counterparts from Gaia DR3 (Gaia Collaboration 2016, 2023) using their XMM-Newton positions, and compared the results to those using the original eROSITA coordinates.
Assuming that the positional uncertainties of both X-ray and optical measurements follow Gaussian distributions centered on the true source location, the angular separation (r) between X-ray and optical positions is expected to follow a Rayleigh distribution:
 (1)
(1)
where σsep is the combined positional uncertainty. Fitting the histograms of eROSITA-Gaia and XMM-Gaia separations yields σsep = 3.44" between Gaia and eRASS1, and σsep = 0.89" between Gaia and XMM-Newton, reflecting the improved astrometric accuracy of the XMM-Newton due to its better angular resolution and longer exposure, as shown in Fig. 4. Out of 158 sources, we find that 146 have Gaia counterparts within 4", and we applied a conservative threshold of about 4.5 σsep here2.
There are 12 sources, including three hard-only objects, with no Gaia counterpart within 4″.
These sources may be undetected by Gaia due to high X-ray-to-optical flux ratios, as seen in XRBs or active galactic nuclei (AGNs), because they are distant, heavily obscured, because of other intrinsically faint conditions that place them below the Gaia sensitivity limits.
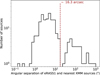 |
Fig. 2 Angular separation between the eRASS1 sources and the nearest XMM-Newton sources. The prominent bimodal distribution indicates a natural separation threshold at approximately ∼16.3″, which we used to distinguish true associations from random alignments. |
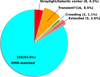 |
Fig. 3 Results of cross-matching eRASS1 and XMM sources. Among the 189 eRASS1 sources within the XMM-Newton footprint, 158 have reliable XMM counterparts. The remaining 31 are categorized as potentially extended sources, source confusion in crowded regions, transient candidates, or stray light contamination/Galactic center sources and thus not included in the XMM filtered catalog. |
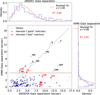 |
Fig. 4 Angular separation distributions for matched eRASS1, XMM-Newton, and Gaia sources. Histograms (top and right panels) display eRASS1-Gaia and XMM-Gaia separations, respectively. Rayleigh fits (dashed red lines) yield characteristic uncertainties of σsep = 3.44″ for eRASS1-Gaia pairs and σsep = 0.89″ for XMM-Gaia pairs. Main panel: eRASS1-Gaia versus XMM-Gaia separation, with the y=x equality shown as a dashed black line. Good HamStar matches are blue dots. Bad HamStar matches are red dots, and their source indices are provided. Sources without a HamStar match are represented by dark gray dots, and indices of vertical outliers (XMM-Gaia separations > 4″ ) are labeled in black. |
3.1 Comparison to the HamStar catalog
Freund et al. (2024) introduced the HamStar method, a Bayesian framework developed to identify coronal X-ray sources in the eRASS1 catalog by associating them with Gaia DR3 counterparts. This method estimates the probability of a source being coronal by incorporating both geometric parameters, such as angular separation and positional uncertainty, and source properties, including X-ray flux, optical color, and distance.
Within our sample of 158 sources, 108 were previously classified as coronal by the HamStar algorithm based on their eROSITA positions. After re-performing the cross-match using XMM-Newton coordinates, we find that 102 of these sources have the same Gaia counterpart as originally identified by HamStar, with the X-ray-to-optical separations significantly reduced to within 4″. We refer to these as “good” matches, indicated by the blue dots in the main panel of Fig. 4.
The remaining six HamStar sources are classified as “bad” matches. Unlike the good matches, whose X-ray-optical separations typically decreased when using the more accurate XMM-Newton positions, these sources show the opposite behavior: their previously assigned Gaia counterparts from the HamStar catalog exhibit larger separations after applying the XMM-Newton astrometry. Therefore, we considered these to be likely false associations. Among them, four are now more closely matched to different Gaia counterparts with separations of less than 4″ from the original eROSITA-Gaia matches, classified as a “different match for HamStar” in Fig. 3. The remaining two (Src 78 and Src 170) have no Gaia match within 4″. These are shown as red dots in Fig. 4.
The remaining 50 sources were not included in the HamStar catalog primarily because the method incorporates not only positional coincidence but also multiwavelength criteria, including X-ray flux, optical color, and parallax within a Bayesian framework. Consequently, a Gaia source within the matching radius can be rejected if its properties (e.g., X-ray-to-optical flux ratio, color) deviate from those typical of coronal emitters. This conservative approach favors reliability but may miss valid associations. By re-matching with improved XMM positions, we recovered additional plausible Gaia counterparts (40 out of 50) that were previously excluded due to stricter priors of HamStar. The enhanced X-ray astrometry of XMM-Newton leads to more precise associations, reducing the number of ambiguous or false matches. The overall Gaia matching results are summarized in the pie chart in Fig. 5.
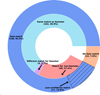 |
Fig. 5 Gaia matching results for the 158 XMM-Newton-detected eRASS1 sources. |
3.2 False-match probability
Due to significant spatial variation in the stellar density across our field of view, the likelihood of falsely associating an X-ray source with a random Gaia counterpart can vary substantially. To account for this, we estimated the probability of a chance (i.e., false) match for each XMM-Newton source based on the local density of Gaia detections.
For each X-ray source, we calculated the surface density of Gaia sources within a 1′ radius, denoted as ρGaja (in arcsec−2). Assuming a uniform background distribution, the probability that at least one unrelated Gaia source lies within a circular matching radius rmatch is given by the Poisson expression (Sutherland & Saunders 1992)
 (2)
(2)
This formula provides a statistical estimate of the likelihood that a given Gaia match is spurious, based purely on positional coincidence and local source density. We computed Pfalse for all 146 Gaia-matched sources in our sample and listed their results in Table A.1, providing a quantitative measure of counterpart reliability. The majority of sources (∼88%, 129 out of 146) have Pfalse < 0.05, suggesting high-confidence associations. The remaining 17 sources (12%), primarily located in crowded or high-density regions, exhibit higher false-match probabilities. These “low-confidence matches” are discussed in detail in Sect. 5.
While we adopted Pfalse < 0.05 as a threshold to assess the reliability of Gaia counterparts, we chose to retain all associations within 4″ in our analysis, regardless of their individual Pfalse values. This approach is intended to preserve sample completeness and maintain internal consistency across the dataset, particularly when comparing sources with and without prior classifications. Moreover, many of the sources with higher Pfalse values are located in crowded Galactic regions, where source confusion is inherently high and positional offsets alone may not fully account for the counterpart uncertainty. By including all matches within 4″, while explicitly flagging those with Pfalse > 0.05, we ensured that potentially genuine associations were not prematurely excluded, while allowing users to apply more stringent reliability criteria based on specific scientific objectives.
Overall, 146 of the 158 eRASS1 sources detected with XMM-Newton have Gaia counterparts within 4″, including 102 that are consistent with HamStar classifications. The remaining 44 Gaia associations, made possible by the improved astrometry from XMM, supplement the HamStar catalog and enhance the completeness of our sample. Adopting a conservative threshold of Pfalse < 0.05 as a criterion for secure identification, we estimate the reliability of the Gaia-matched counterparts in our sample to be approximately 88%.
4 Spectral analysis
The nature of most eRASS1 sources remains uncertain due to the limited photon counts, which hinder reliable spectral characterization. While the HamStar method offers a promising approach by applying photometric measurements of potential optical counterparts to identify coronal sources, the reliability of this classification has yet to be systematically validated. Our deep XMM-Newton survey toward the inner Galactic disk, covering a subset of eRASS1 sources, enables not only improved X-ray positions but also detailed X-ray spectral analysis, thereby allowing for more robust source classification.
For each source, we extracted the source and background spectra using the SAS task evselect. Events with PATTERN ≤4 for EPIC-pn and PATTERN ≤12 for MOS1/MOS2 detectors were selected. The source products were extracted from a circular region with a radius of 25″ centered on the source position, while the background was extracted from an annular region centered on the same position, with inner and outer radii of 50″ and 100″, respectively. Ancillary response files and redistribution matrix files were generated accordingly. The spectra from individual observations were then co-added to produce a combined spectrum for each source by using the SAS task epicspeccombine . The combined spectra were adaptively binned to achieve a signal-to-noise ratio (S/N) greater than two per energy bin.
Since our sources were selected from the eRASS1 catalog, we have a prior expectation, supported by Sect. 3.1 and Fig. 5, that the majority (≳70%) are coronal sources identified by cross-identification in the HamStar catalog. These sources are expected to exhibit thermal plasma spectra, while a subset of other sources may instead show nonthermal spectra. To account for both possibilities, we adopted a phenomenological spectral modeling approach using the Python interface to XSPEC (Gordon & Arnaud 2021). Each spectrum was independently fit with two alternative models: an absorbed thermal plasma model (tbabs×apec) and an absorbed power-law model (tbabs×powerlw). Both models have a small number of free parameters, allowing us to directly compare the absolute chi-squared (χ2) values under two models. The power-law model was adopted only if it yielded a significantly better fit, defined by a decrease in chi-squared of ∆χ2 > 9.0 compared to the thermal model. This threshold corresponds to approximately 3σ of the chi-squared distribution with equal degrees of freedom, indicating strong statistical preference for the power-law model. In all other cases, we adopted the thermal model given its physical relevance for stellar coronal emission and the prior expectation for coronal sources.
For all remaining sources, we used the absorbed thermal plasma model. The Galactic absorption was modeled using the tbabs component (Wilms et al. 2000). The apec3 component represents emission from an optically thin, collisionally ionized plasma and is characterized by three parameters: the plasma temperature (kT), the global metal abundance (Z), and the emission measure (EM). The emission measure is proportional to the integral of the squared electron density over the emitting volume and is derived from the model normalization, assuming a known distance to the source (Magaudda et al. 2022).
Each spectrum was fit with either a single-temperature model, tbabs×apec, or a two-temperature model, tbabs×(apec+apec), depending on the quality of the fit. In particular, if the single-temperature model yielded a reduced chi-squared  , we adopted a two-temperature model to improve the fit. For these two-component fits, we also derived a mean coronal temperature (Tmean), calculated as the emission measure-weighted average of the component temperatures:
 (3)
(3)
where n = 1, 2 corresponds to the two components in the bestfitting model.
The best-fitting parameters, including Γ or Tmean where applicable, are presented in Table A.1. For sources with distance measurements, we also report the unabsorbed X-ray luminosity in the 0.2-10 keV band based on the best-fit spectral model.
5 Classification of the eRASS1 sources
5.1 Classification methodology
With reliable Gaia counterparts identified for the majority of sources, we classified all 158 eRASS1 sources with available XMM-Newton spectra based on a combination of optical photometry and X-ray spectral properties. While 17 sources have Gaia associations considered to be low-confidence matches (i.e., with a false-match probability exceeding 5%), this does not significantly impact our classification or conclusions. As detailed below, 11 of these sources already have secure identifications in SIMBAD, and the remaining 6 are classified primarily based on their distinct X-ray spectral characteristics. Therefore, the inclusion of these low-confidence matches does not compromise the robustness of our overall classification.
5.1.1 X-ray spectral properties of SIMBAD-classified sources
We first cross-matched the 158 X-ray sources with the SIM-BAD database and identified counterparts for 99 of them. These include:
61 classified as “stars,” “rotating variables,” or “eclipsing binaries” - all interpreted as coronally active stars;
16 classified as young stellar objects (YSOs) or YSO candidates, also considered as active stars;
3 long-period variable candidates (LP?)
4 CVs;
2 ABs (RS CVn systems);
4 massive OB stars (3 Be stars, 1 Wolf-Rayet star);
2 isolated neutron stars (NSs; including 1 X-ray pulsar);
4 low-mass X-ray binaries (LMXBs);
2 high-mass X-ray binaries (HMXBs);
1 AGN.
The remaining 59 sources lack definitive classifications. We used the 99 SIMBAD-identified sources as a reference sample and plot their mean coronal temperature (kTmean) versus X-ray flux in Fig. 6.
We find that nearly all coronally active stars (and YSOs, hereafter referred to as “active stars” in the figures for simplicity) have kTmean < 2 keV, suggesting a practical threshold to distinguish coronal stars from others. Based on this, we conservatively assigned a temporary classification of active stars to all unclassified sources with kTmean < 2 keV. However, we note that some massive OB stars in the SIMBAD sample also fall below this temperature threshold, and therefore misclassification is possible (see the detailed discussion in Sect. 5.1.3). Additionally, although both confirmed ABs exhibit kTmean > 2 keV, we assume that some ABs also lie below 2 keV and cannot be reliably distinguished from other coronal sources using spectral and photometric information alone.
5.1.2 Distinguishing compact objects via the X-ray main sequence diagram
To further distinguish accreting compact objects from coronal sources with hard spectra, i.e., the unclassified sources with kTmean > 2 keV in Fig. 6, we adopted the X-ray main sequence diagram proposed by Rodriguez (2024). This diagnostic separates populations based on Gaia optical color (BP-RP) and the X-ray-to-optical flux ratio (FX/Fopt). The empirical boundary is given by
 (4)
(4)
X-ray fluxes are taken from our best-fit models (Sect. 4) and corrected for absorption using the corresponding best-fit column densities (NH). Gaia magnitudes were extinction-corrected using the 3D dust map from Lallement et al. (2019). When available, distances were adopted from distance_gspphot in Gaia DR3; otherwise, inverse parallax was used if parallax_over_error > 3.0. The extinction corrections applied were based on Wang & Chen (2019), using the relations: AV = 3.16 × E(B - V), AG = 0.789 × AV, ABP = 1.002 × AV, ARP = 0.589 × AV.
The six known compact objects with Gaia counterparts (four CVs and two XRBs) all lie above the empirical cut, validating its effectiveness. Among the unclassified sources, nine lie above the cut. Of these, six with kT >2 keV are classified as CV candidates due to their elevated FX/Fopt ratios and hard X-ray spectra, consistent with the known CVs.
The remaining four unclassified sources with kTmean > 2 keV, represented by red triangles in Fig. 7 but lying below the empirical flux threshold, are X-ray faint and thus unlikely to be accreting systems. They are most likely ABs or OB stars based on the spectral properties of the confirmed sample in Fig. 6. The characterization of them will be discussed further based on their optical colors (see Sects. 5.1.3 and 5.2).
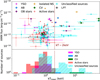 |
Fig. 6 XMM-Newton flux and thermal temperature distributions. Top: 0.2-10 keV unabsorbed X-ray flux versus the APEC best-fit temperature (kT) for different source classes. Bottom: histogram of the best-fit mean temperatures for each category. |
5.1.3 Gaia color-magnitude diagram
For sources with distance measurements from Gaia, we constructed the Hertzsprung-Russell diagram using extinction-corrected BP-RP colors and absolute G-band magnitudes. Figure 8 displays the Hertzsprung-Russell diagram, with X-ray luminosity (from unabsorbed 0.2-10 keV spectral fits) encoded in color. For comparison, we overlay PARSEC stellar isochrones corresponding to ages of 40 Myr and 4 Gyr, representing young and old stellar populations, respectively (Bressan et al. 2012).
A prominent group of 12 sources occupies the bright, blue region of the diagram (approximately MG = −5 to −2), consistent with massive early-type O and B stars. These sources also exhibit relatively high X-ray luminosities in the range LX ∼ 1031−33 erg s−1. In contrast to late-type stars, whose X-ray emission originates from magnetically heated coronae, OB stars produce X-rays through embedded wind shocks in their radiatively driven stellar outflows.
Despite applying extinction corrections based on 3D dust maps (Lallement et al. 2019), these sources identified as massive OB stars still appear significantly redder than expected in the Gaia color-magnitude diagram (CMD). This discrepancy may be due to several factors. First, the extinction corrections themselves are subject to uncertainties, particularly along sightlines with complex or nonuniform dust structures. In regions of high or patchy extinction, the adopted AV values from 3D maps may underestimate the total line-of-sight reddening, especially if the stars lie behind concentrated dust clouds or at distances where the dust model becomes less constrained. Additionally, OB stars embedded in or near star-forming regions can be affected by local circumstellar or nebulous material, which would cause their colors to remain anomalously red even after standard extinction correction procedures.
Two exceptional outliers with extremely red colors and high optical luminosities significantly above the main sequence - Src 36 and Src 116 - are identified as candidate symbiotic stars (SySts), a rare class of interacting binaries where a compact object (typically a white dwarf or NS) accretes material from a red giant companion. Source properties of these two are discussed further in Sect. 5.3.3. Finally, sources lying above the empirical cut in the X-ray main sequence diagram (Sect. 5.1.2) are annotated in the figure with black source IDs, these along with candidates for ABs, and those sources without Gaia counterparts are discussed in detail in the following sections.
In summary, we identify 112 coronally active stars (including 16 YSOs), 5 ABs, 12 early-type stars (hereafter OB stars), 12 CVs, 2 SySts, 3 long-period variables (LPVs), 7 LMXBs, 2 HMXBs, 2 isolated NSs, and 1 AGN, as summarized in Fig. 9.
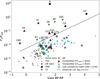 |
Fig. 7 X-ray main sequence diagram: X-ray-to-optical flux ratio (FX/Fopt) against Gaia BP-RP color. The solid line shows the empirical boundary separating accreting compact objects from coronal sources. Labels indicate sources beyond the empirical cut. Low-confidence matches are indicated by open black circles. |
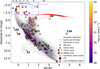 |
Fig. 8 Gaia Hertzsprung-Russell diagram for sources with distance estimates. The x-axis shows the Gaia BP-RP color, and the y-axis shows the absolute G-band magnitude. The color bar indicates the unabsorbed 0.2-10 keV X-ray luminosity. Overplotted are PARSEC isochrones for stellar populations of 40 Myr (blue) and 4 Gyr (red). Sources above the empirical cut in the X-ray main sequence diagram are labeled with black source IDs, while two γ Cas candidates are marked in red. Two extremely “red” outliers are marked as SySt candidates. Low-confidence matches are shown as open black circles. |
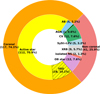 |
Fig. 9 Source classification of 158 XMM-Newton-detected eRASS1 sources. |
5.2 Coronal sources
Of the 158 X-ray sources in our sample, 120 are classified as coronal emitters based on a combination of reliable Gaia photometry (when available and of high confidence) and their soft thermal X-ray spectra. For sources lacking reliable Gaia counterparts, the classification relies solely on X-ray spectral properties.
These sources primarily include active single stars (including YSOs) and ABs. Among the more luminous or harder X-ray sources, ABs are the most likely classification. ABs typically consist of a slightly evolved subgiant and a solar- or late-type companion. Their orbital periods range from several hours to tens of days, inducing rapid stellar rotation and enhanced magnetic activity (Walter & Bowyer 1981). This results in strong coronal X-ray emission, typically with X-ray luminosities of LX ∼ 1028-1032 erg s−1 (Audard et al. 2003; Sazonov et al. 2006). Due to their abundance and relatively faint X-ray fluxes, ABs are recognized as major contributors to the GRXE (Revnivtsev et al. 2006).
However, identifying ABs based solely on spectral hardness and optical photometry remains difficult, especially when distinguishing them from active single stars. Nevertheless, according to the SIMBAD database, two known RS CVn-type systems (Src 93 and Src 153) are identified in our sample. These are composed of a subgiant or giant primary with a tidally locked late-type companion, and exhibit elevated X-ray luminosities (LX ∼ 1031-1032 erg s−1) due to intense magnetic activity.
In addition to the sources discussed above, three additional objects (Src 68, Src 80, and Src 104) exhibit hard X-ray spectra with kT > 2 keV, suggesting they are likely ABs. Their elevated plasma temperatures make them unlikely to be active single stars (Fig. 6). Furthermore, their relatively low X-ray-to-optical flux ratios argue against an interpretation as accreting compact objects. Their locations on the CMD (Fig. 8) are also inconsistent with the properties expected for massive OB stars. Based on this multiwavelength evidence, we classify these three sources as candidate ABs, marked with gray-edged boxes in Fig. 8.
5.3 Non-coronal sources
5.3.1 Early-type stars (binaries)
Early-type O and B stars are prominent X-ray emitters in young stellar populations. Unlike late-type stars, whose X-ray emission is powered by magnetically heated coronae, OB stars generate X-rays through embedded shocks within their radiatively driven stellar winds. These processes typically produce soft thermal spectra with plasma temperatures of kT ∼ 0.5−1 keV, and X-ray luminosities reaching LX ∼ 1031−33 erg s−1 (Nazé 2009), especially in binary systems where wind-wind collisions can significantly enhance the emission (Cohen et al. 2021; Rauw 2022).
We identify a group of 12 sources in the CMD (Fig. 8) consistent with massive OB stars, roughly spanning absolute G-band magnitudes of MG = −5 to −2, and exhibit X-ray luminosities in the range LX ∼ 1031−33 erg s−1. Their positions in the CMD and X-ray properties are consistent with wind-driven emission from young, massive early-type stars.
Among this group, two sources (Src 43 and Src 72; highlighted with red labels in Fig. 8) are noteworthy for their unusually hard X-ray spectra, as presented in Fig. B.1. Spectroscopic observations confirm that both have classical Be star optical counterparts - early B-type stars that exhibit Balmer-line emission from circumstellar decretion disks. Their X-ray spectra require hot thermal components with plasma temperatures of kT ∼ 5−10 keV, far exceeding those expected from typical OB stars (Nazé 2009).
With X-ray luminosities around LX ∼ 1032 ergs−1, these sources exhibit a combination of characteristics consistent with the rare class of γ Cassiopeiae (γ Cas) analogs (Nazé & Motch 2018). However, due to the limited quality of the available X-ray spectra, we cannot conclusively detect key spectral diagnostics, such as an Fe XXV line, nor can we robustly distinguish between a hot thermal plasma and a power-law continuum. Therefore, we cannot rule out other plausible interpretations. For instance, quiescent Be-NS binaries can also display comparable hard spectra and X-ray luminosities (Elshamouty et al. 2016). Distinguishing between a γ Cas analog and a quiescent Be-NS binary in these sources would require higher-quality X-ray spectra and long-term X-ray monitoring to search for transient behavior.
In summary, we identify 12 sources in our sample whose X-ray emission is consistent with wind-powered processes in massive OB stars. We classify these objects as non-coronal sources, emphasizing that their X-ray emission arises through fundamentally different mechanisms compared to the magnetically heated coronae of late-type stars and is also distinct from accretion-powered sources such as CVs and LMXBs.
5.3.2 Cataclysmic variables
Our sample includes four known CVs listed in the SIM-BAD database: AX J1740.3-2904, AX J1740.1-2847, 4XMM J173058.9-350812, and V478 Sco. The first three were also identified with periodicities in our earlier work using the XMM Heritage survey (Mondal et al. 2024).
In addition, we identify eight new CV candidates based on their elevated X-ray luminosities relative to the X-ray main sequence and/or their hard X-ray spectra, both of which are indicative of accreting compact binaries rather than coronal sources. Their spectra plots with best-fit models are presented in Fig. B.2. It is worth noting that Src 34 yields a potential super-solar abundance at  . Such high abundances are unusual for CVs, where plasma metallicities are typically subsolar to solar (Yuasa et al. 2010). Similar cases have occasionally been reported in a few systems (Harrison 2016), possibly reflecting peculiar donor compositions or accretion histories. Given the modest S/N of our data and potential model degeneracies, this result should be interpreted with caution and requires confirmation with deeper observations.
Two of these candidates (Src 138 and Src 144) lack Gaia counterparts, suggesting either large distances or optically faint donor stars. Both exhibit high plasma temperatures (kT > 5 keV), consistent with emission from the accretion column. Src 138 also shows prominent Fe XXV and Fe XXVI emission lines at 6.7 and 7.0 keV, respectively, strongly supporting its classification as a CV. Although Src 144 has fewer counts and lacks identifiable Fe line features, we tentatively classify Src 144 as a CV candidate, while a quiescent LMXB cannot be ruled out.
Among the remaining six candidates, four sources (Src 34, Src 53, Src 123, and Src 173) have Gaia counterparts with false-match probabilities exceeding 5%, indicating that their associations are not secure. Nevertheless, all four exhibit hard X-ray spectra with kT > 4 keV, consistent with the spectral properties of confirmed CVs shown in Fig. 6. In addition, Src 34, Src 53, and Src 123 display prominent Fe XXV emission lines, a characteristic feature of CVs, further supporting this classification. Src 173, on the other hand, lacks clear a Fe line detection due to limited spectral quality.
We also examined the Gaia CMD (Fig. 8). Three candidates (Src 34, Src 37, and Src 146) lie along the white dwarf sequence, lending further support to their identification as CVs. Interestingly, most known CVs and our additional candidates do not appear on the white dwarf branch in the Gaia CMD. This is not unexpected as CVs are interacting binaries where the optical emission might be dominated by the donor star or the accretion disk, rather than the white dwarf itself. Particularly in systems with luminous secondaries or high accretion rates, the observed colors and magnitudes deviate significantly from those of isolated white dwarfs.
In summary, we identify eight new candidate CVs, in addition to the four previously known systems. These candidates are primarily selected based on their locations in the X-ray main sequence diagram (Fig. 7), which serves as an effective diagnostic tool for distinguishing accreting systems from coronal sources. Further support for their classification comes from their positions in the CMD (Fig. 8), where three of the new candidates fall along the white dwarf sequence, consistent with expectations for CVs. Despite uncertainties or potential mismatches in their Gaia associations, the X-ray spectral properties of these sources, characterized by high plasma temperatures and prominent Fe XXV/Fe XXVI line emission, provide additional evidence for their identification as accreting white dwarf systems.
5.3.3 Symbiotic stars and long period variables
Src 36 and Src 116 stand out as clear outliers in the Gaia CMD (Fig. 8), exhibiting extremely red colors (BP−RP > 3) and luminosities significantly above the main-sequence, consistent with late-type giants (Merc et al. 2020; Ball et al. 2025). Their X-ray spectral plots are presented in Fig. B.3. Both sources have LX ≳ 1032 erg s−1 and display relatively soft X-ray spectra with plasma temperatures of kT ∼ 1-2 keV, which are notably softer than typical CVs. Notably, Src 36 was previously identified as an asymptotic giant branch star based on infrared photometry (Guerrero et al. 2024), further supporting it could be a SySt in which a white dwarf or NS accretes material from an asymptotic giant branch donor.
We classify these two objects as strong candidates for SySts. These systems are characterized by very long orbital periods (Porb ≳ 200 days), strong optical and infrared emission from the giant star, and diverse X-ray properties that range from soft, thermal spectra to harder, more complex emission depending on the accretion regime and the presence of winds or shocks (Luna et al. 2013).
In addition to these two symbiotic candidates, our sample contains three sources identified as LPVs by Lebzelter et al. (2023). The presence of X-ray emission in these LPVs, a phenomenon not inherent to these single stars, is probably due to wind accretion onto an unseen white dwarf companion, as also suggested by Schmitt et al. (2024). Given this shared mechanism, we group the LPV candidates with the SySts. However, it is important to note that without UV data to confirm the presence of a hot companion, the exact origin of their X-ray emission remains uncertain.
5.4 Isolated neutron stars
Our sample includes two sources classified as isolated NSs. And their X-ray spectra are shown in Fig. B.5. Src 7 is a central compact object (CCO) located within the supernova remnant HESS J1731−347. This source has been proposed as the lightest NS ever observed, with estimated  (Doroshenko et al. 2022). It exhibits a soft, thermal X-ray spectrum well described by a blackbody model with a temperature of kT ∼ 0.5 keV, and an unabsorbed luminosity of LX ∼ 2 × 1034 erg s−1. Another isolated NS in our sample is Src H2, corresponding to PSR J1747−2958 - an X-ray pulsar discovered within the “Mouse” radio nebula (G359.23−0.82), with a spin period of P = 98 ms (Camilo et al. 2002). It is identified as a hard-only source, exhibiting a hard X-ray spectrum (Γ ∼ 1.77) and a luminosity of LX ∼ 9 × 1033 erg s−1.
5.5 LMXBs and HMXBs
Four LMXBs (Src 1, Src 2, Src 4, and Src 5) and two HMXBs (H1, H7) are classified based on entries in the SIM-BAD database, with additional support from their X-ray spectral properties, despite the lack of confirmed optical counterparts.
In addition, we identify three new LMXB candidates and present their spectral plots in Fig. B.4. Src 6, situated in the globular cluster Liller 1, shows a hard X-ray spectrum (Γ ∼ 1.34) and an X-ray luminosity of LX ∼ 5 × 1033 erg s−1. This source was also reported as a new X-ray transient by Swift (Homan et al. 2018). Assuming a cluster distance of 8.2 kpc (Harris 1996), the peak 0.5-10 keV luminosity reaches ∼5.5 × 1035 erg s−1 (Homan et al. 2018).
Src 32 lacks a Gaia counterpart and therefore cannot be reliably placed on the X-ray main sequence diagram for classification. However, its X-ray spectrum is exceptionally hard, characterized by a power-law photon index of Γ ∼ 1.5, and shows no detectable Fe XXV or Fe XXVI emission lines. Spectral modeling reveals substantial absorption, with a column density of NH ∼ 2.5 × 1022 cm−2. According to the 3D dust extinction map from Lallement et al. (2019), we estimate a minimum distance of ∼3 kpc for this source. At this distance, the implied X-ray luminosity exceeds LX ≈ 3 × 1033 (d/3 kpc)2 erg s−1. Taken together, the high intrinsic absorption, hard spectrum with no Fe line features, and high luminosity strongly suggest that Src 32 is a LMXB candidate.
Src H5 also lacks a Gaia counterpart and exhibits a hard X-ray spectrum (Γ ∼ 1.43) with no discernible Fe XXV or Fe XXVI emission lines. This source was initially detected as a transient by Swift-XRT in May 2012 (Bandyopadhyay et al. 2012), reaching a luminosity of ∼3.8 × 1036 erg s−1 (assuming 8 kpc). In our observations, we found the source to be approximately 20 times fainter, with a luminosity of ∼1.9 × 1035 erg s−1 (also for 8 kpc). Bandyopadhyay et al. (2012) ruled out the possibility of it being a supergiant fast X-ray transient due to the absence of infrared stellar sources within its error circle. Based on these findings, we tentatively classify Src H5 as an LMXB.
5.6 Background AGN
Src 3 is the only AGN identified in our sample. It has been classified as a Seyfert 2 galaxy with a redshift-estimated distance of approximately 93 Mpc (Koss et al. 2022), corresponding to an X-ray luminosity of LX ∼ 6.2 × 1043 erg s−1. According to Waddell et al. (2024), a total of 2547 eRASS1 sources are classified as reliable AGN candidates across the western Galactic hemisphere. Given our survey’s sky coverage of roughly 20 deg2, we expect ∼1.23 AGNs to fall within this region, which is consistent with the single AGN identified in our sample.
6 Discussion
6.1 An empirical hardness ratio cut to identify accreting compact objects in eRASS1
Due to limited photon statistics, the majority of eRASS1 sources lacks high-quality X-ray spectra. Consequently, the HR serves as a practical proxy for distinguishing different classes of X-ray emitters. Our sample, which includes tentative classifications based on XMM-Newton spectra, provides a representative subset of the X-ray source population along the Galactic plane.
We classified the sources into two broad categories: coronal sources, including coronally active stars and ABs; and noncoronal sources, comprising wind-powered massive OB stars, isolated NSs and accreting compact objects including CVs, SySts, LMXBs, and AGNs. Using HRs measured by eROSITA, defined here as HR = (H − S)∕(H + S), where S and H represent count rates in the 0.2-2 keV and 2-8 keV bands, respectively, we find that a threshold at HR > −0.2 effectively separates noncoronal (red cross) from coronal sources (black cross with green dots) as shown in Fig. 10.
To generalize this empirical cut, we examined all eRASS1 sources located along the Galactic plane (|b| < 1°). As shown in Fig. 10, out of 4774 such sources, 2757 are identified as coronal using the HamStar classifier (excluding those flagged with OB_STAR == “TRUE”). Only 13 of these coronal sources exhibit HR > −0.2, corresponding to an efficiency of ∼99.6% in rejecting coronal contaminants. Among all 4774 sources, 149 satisfy the HR > −0.2 criterion. After accounting for the 13 coronal contaminants, this yields a selection purity of approximately 91%, strongly suggesting that the majority of HR-selected sources are non-coronal sources. This minor contamination can be attributed to rare cases where very hot and heavily absorbed coronal sources exhibit HRs above our -0.2 threshold. For example, in an extreme case of a coronal source with kT = 2.0 keV and LX ∼ 1032 erg s−1, an absorption of NH = 3.5 × 1021 cm−2 would shift its HR upward. Such a source would remain detectable within < 1.5 kpc given the eRASS1 sensitivity limit.
Further support for this HR cut comes from XMM-Newton data, where better-constrained HRs are available (Fig. 11). Among 117 sources classified as coronal via their XMM spec-tra+Gaia cross-match, only 3 exceed HR > −0.2. In contrast, 20 of 41 non-coronal sources fall above this threshold, resulting in a selection purity of ∼87%. This is consistent with the result derived from the eRASS1 sample and further reinforces the reliability of the HR cut. The minor discrepancy can be attributed to the ∼91.5% completeness of the HamStar classification scheme (Freund et al. 2024). Notably, all but one of the LMXBs in the labeled sample lie above the threshold, highlighting the effectiveness of the HR cut in identifying this population. The selection also successfully recovers over half of the CVs and a subset of wind-powered OB stars. Residual contamination primarily stems from a few active stars and ABs with intrinsically hard X-ray spectra and low photon statistics.
According to Waddell et al. (2024), 2547 eRASS1 sources are reliable AGN candidates. Assuming a uniform sky distribution and accounting for the effects of Galactic extinction, no more than ∼44 AGNs are expected within |b| < 1°. Even under the conservative assumption that all of these AGNs satisfy HR > −0.2, this still leaves ∼90 sources as OB stars and Galactic accreting systems, such as XRBs and CVs. Referring to the cataloged Galactic XRBs (Avakyan et al. 2023; Neumann et al. 2023), we identify 17 known LMXBs and 20 known HMXBs within I b I < 1°. Of these, 14 LMXBs and 12 HMXBs satisfy the HR cut, supporting the use of HR > −0.2 as a simple yet efficient empirical criterion for isolating accreting compact objects, particularly LMXBs, within the eRASS1 Galactic plane sample.
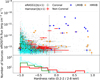 |
Fig. 10 HR versus flux for eRASS1 Galactic plane sources. Upper panel: HR against the 0.2-8 keV flux for eRASS1 sources within |b| < 1°. The vertical dashed line represents an empirical cut at HR=-0.2. Known Galactic LMXBs and HMXBs from Avakyan et al. (2023) and Neumann et al. (2023) are indicated by blue and orange squares, respectively. Lower panel: HR histograms for different source categories. |
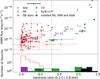 |
Fig. 11 HR versus 0.2-10 keV flux from XMM spectral fitting. Upper panel: HR against 0.2-8 keV flux. The vertical dashed line represents the empirical cut at HR=-0.2. Lower panel: HR distributions for different source classes. |
6.2 Resolved point source contribution to the GRXE
Using data from our XMM-Newton heritage survey, we measured the X-ray surface brightness toward the inner Galactic disk. The total X-ray photon flux is converted into energy flux assuming a thermal plasma with temperature kT ∼ 10 keV, representative of the GRXE spectrum observed by Chandra (Revnivtsev et al. 2009). Surface brightness values are computed in five standard energy bands: 0.2-0.5, 0.5-1.0, 1.0-2.0, 2.0-4.5, and 4.5-12.0 keV, across the western portion of our sky coverage, excluding the central 15′ around the Galactic center.
The total surface brightness of GRXE has been measured previously by other missions. In the “limiting window” region (lII = 0.113°, b11 = −1.424°), Revnivtsev et al. (2009) reported a total X-ray surface brightness of I2-10kev = 8.6 × 10⁻¹¹ erg s−1 cm−2 deg−2 based on a 1 Ms Chandra observation. Adopting the same thermal model of kT ∼ 10 keV, this corresponds to I2-12 keV = 10−10 erg s−1 cm−2 deg−2. For comparison, our measurements using XMM-Newton data yield a slightly higher, yet broadly consistent surface brightness of I2-12 keV = 1.2 × 10⁻¹⁰ erg s−1 cm−2 deg−2 in the same region. These values are indicated as dashed red and blue lines in Fig. 12 for direct comparison.
In addition, we stacked the X-ray spectra of each major source class identified in our sample and re-binned their photon flux densities into five standard energy bands: 0.2-0.5, 0.5-1.0, 1.0-2.0, 2.0-4.5, and 4.5-12.0 keV (Fig. 12). The eRASS1-selected sample, with a typical sensitivity limit of ∼5 × 10⁻¹⁴ erg cm−2 s−1 in the 0.5-2.0 keV band, provides a flux-limited view of the soft Galactic X-ray source population. At this detection threshold, we find that resolved point sources account for approximately 3.0%, 6.2%, 4.5%, 12.8%, and 10.3% of the GRXE surface brightness in the 0.2-0.5 keV, 0.5-1.0 keV, 1.0-2.0 keV, 2.0-4.5 keV, and 4.5-12.0 keV bands, respectively. In the soft X-ray regime (below 1 keV), the resolved emission is overwhelmingly dominated by coronally active stars, which account for more than 80% of the detected point sources. The majority of these sources are foreground objects located within 1 kpc, a finding that supports the long-standing hypothesis that late-type stars are the primary point-source class contributing to the soft component of the GRXE (Revnivtsev et al. 2006; Revnivtsev & Sazonov 2007). The resolved composition from this representative region therefore provides a crucial benchmark for the source populations expected from eRASS observing results of the broader Galactic plane.
It worth noting that the observed resolved fraction is subject to significant selection effects. Due to the high level of interstellar absorption toward the inner Galactic disk, the vast majority of our resolved X-ray sources are foreground stars. Thus, the resolved fraction of soft X-ray sources presented here is a lower limit to the intrinsic contribution of stars to the GRXE. Despite the improved angular resolution and sensitivity, more than 90% of the GRXE remains unresolved across all energy bands, implying a substantial faint X-ray source population lying below the eRASS1 flux limit. While previous deep Chandra observations (Revnivtsev et al. 2009; Hong et al. 2012) have shown that over 80% of the hard (6-7 keV) GRXE can be resolved into point sources (primarily CVs and ABs), the limited effective area of eROSITA in the hard X-ray band reduces its sensitivity to such faint, hard-spectrum sources.
Our findings are consistent with previous deep-field surveys, which emphasize that resolving the bulk of the GRXE requires significantly deeper exposures (≲10−15 erg cm−2 s−1) and higher spatial resolution. Nonetheless, our work represents a significant step forward: for the first time, the soft X-ray spectral component of the GRXE has been decomposed into contributions from distinct source classes, enabled by combining X-ray spectroscopy with Gaia-based optical classifications. Future missions such as AXIS, with its planned Galactic Survey program, will enable an even deeper and more complete resolution of the GRXE.
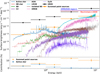 |
Fig. 12 Stacked X-ray spectra of classified source populations from the eRASS1 sample (colored lines), compared to the GRXE surface brightness (black points) in five broad energy bands. The summed spectrum of all classified point sources is shown as orange squares. |
7 Summary and conclusions
We comprehensively classified 158 X-ray sources toward the inner Galactic disk (350° < l < 360°, |b| < 1°) by combining eRASS1 detections with deeper XMM-Newton observations and Gaia astrometry. Improved XMM-Newton positions allowed us to exclude ∼3% of the matched HamStar sources as false matches. Additionally, 2% of the matched HamStar sources are classified as non-coronal, consistent with their estimated reliability of 91.5%;
Our classification reveals that approximately 74% of eRASS1 sources toward the inner disk are coronal sources (mostly active stars), with X-ray luminosities spanning from 1028 to 1031 erg s−1, including a subset of ABs with LX reaching up to ∼1032 erg s−1. The remaining ∼26% of the sources consist of massive OB stars, CVs with LX ∼ 10301033 erg s−1, isolated NSs, and more luminous sources such as XRBs and background AGNs;
We demonstrate that a simple HR cut (HR > −0.2) efficiently isolates non-coronal sources in the eRASS1 catalog, with a selection purity of ∼91%. This empirical criterion performs well for identifying non-coronal sources in the Galactic plane and is broadly applicable for selecting foreground sources. Applying this cut, we estimate that over 90 eRASS1 sources in the Galactic plane (|b| < 1°), after accounting for AGN contamination, are likely non-coronal;
By stacking the classified eRASS1 sources and comparing their combined X-ray spectra with GRXE measurements, we estimate that ∼6% of the GRXE can be resolved into point sources above the eRASS1 flux limit of ∼5 × 10⁻¹⁴ erg cm−2 s−1 in the 0.5-2.0 keV band, most of which are foreground coronal sources. While the bulk of the soft GRXE remains unresolved, our analysis enables a physical decomposition of its resolved fraction, showing that coronally active stars are the dominant contributors to the soft-band emission.
Data availability
The full version of Table A.1 is available at the CDS via https://cdsarc.cds.unistra.fr/viz-bin/cat/J/A+A/704/A107.
Acknowledgements
T.B. and G.P acknowledge financial support from Bando per il Finanziamento della Ricerca Fondamentale 2022 dell’Istituto Nazionale di Astrofisica (INAF): GO Large program and from the Framework per l’Attrazione e il Rafforzamento delle Eccellenze (FARE) per la ricerca in Italia (R20L5S39T9) G.P. also acknowledges financial support from the European Research Council (ERC) under the European Union’s Horizon 2020 research and innovation program HotMilk (grant agreement No. 865637). SM and MRM acknowledge support from NASA ADAP grants 80NSSC24K0666 and 80NSSC24K0639, respectively. This work has made use of data from the European Space Agency (ESA) mission Gaia (https://www.cosmos.esa.int/gaia), processed by the Gaia Data Processing and Analysis Consortium (DPAC, https://www.cosmos.esa.int/web/gaia/dpac/consortium). Funding for the DPAC has been provided by national institutions, in particular the institutions participating in the Gaia Multilateral Agreement.
References
- Ambruster, C. W., & Wood, K. S. 1986, ApJ, 311, 258 [NASA ADS] [CrossRef] [Google Scholar]
- Audard, M., Güdel, M., Sres, A., Raassen, A. J. J., & Mewe, R. 2003, A&A, 398, 1137 [NASA ADS] [CrossRef] [EDP Sciences] [Google Scholar]
- Avakyan, A., Neumann, M., Zainab, A., et al. 2023, A&A, 675, A199 [NASA ADS] [CrossRef] [EDP Sciences] [Google Scholar]
- Ball, S. E., Bromley, B. C., & Kenyon, S. J. 2025, arXiv e-prints [arXiv:2506.20505] [Google Scholar]
- Bandyopadhyay, R. M., Maccarone, T. J., & Kennea, J. 2012, ATel, 4111, 1 [Google Scholar]
- Bressan, A., Marigo, P., Girardi, L., et al. 2012, MNRAS, 427, 127 [NASA ADS] [CrossRef] [Google Scholar]
- Camilo, F., Manchester, R. N., Gaensler, B. M., & Lorimer, D. R. 2002, ApJ, 579, L25 [Google Scholar]
- Cohen, D. H., Parts, W., Doskoch, G. M., et al. 2021, MNRAS, 503, 715 [NASA ADS] [CrossRef] [Google Scholar]
- Degenaar, N., Wijnands, R., Cackett, E. M., et al. 2012, A&A, 545, A49 [NASA ADS] [CrossRef] [EDP Sciences] [Google Scholar]
- Doroshenko, V., Suleimanov, V., Pühlhofer, G., & Santangelo, A. 2022, Nat. Astron., 6, 1444 [NASA ADS] [CrossRef] [Google Scholar]
- Elshamouty, K. G., Heinke, C. O., & Chouinard, R. 2016, MNRAS, 463, 78 [Google Scholar]
- Freund, S., Czesla, S., Predehl, P., et al. 2024, A&A, 684, A121 [NASA ADS] [CrossRef] [EDP Sciences] [Google Scholar]
- Gaia Collaboration (Prusti, T., et al.) 2016, A&A, 595, A1 [NASA ADS] [CrossRef] [EDP Sciences] [Google Scholar]
- Gaia Collaboration (Vallenari, A., et al.) 2023, A&A, 674, A1 [NASA ADS] [CrossRef] [EDP Sciences] [Google Scholar]
- Gordon, C., & Arnaud, K. 2021, PyXspec: Python interface to XSPEC spectral-fitting program, Astrophysics Source Code Library [record ascl:2101.014] [Google Scholar]
- Guerrero, M. A., Montez, R., Ortiz, R., Toalá, J. A., & Kastner, J. H. 2024, A&A, 689, A62 [NASA ADS] [CrossRef] [EDP Sciences] [Google Scholar]
- Hands, A. D. P., Warwick, R. S., Watson, M. G., & Helfand, D. J. 2004, MNRAS, 351, 31 [Google Scholar]
- Harris, W. E. 1996, AJ, 112, 1487 [Google Scholar]
- Harrison, T. E. 2016, ApJ, 833, 14 [NASA ADS] [CrossRef] [Google Scholar]
- Homan, J., van den Berg, M., Heinke, C., et al. 2018, ATel, 11598, 1 [NASA ADS] [Google Scholar]
- Hong, J., van den Berg, M., Grindlay, J. E., Servillat, M., & Zhao, P. 2012, ApJ, 746, 165 [NASA ADS] [CrossRef] [Google Scholar]
- Hong, J., Mori, K., Hailey, C. J., et al. 2016, ApJ, 825, 132 [Google Scholar]
- Kaneda, H., Makishima, K., Yamauchi, S., et al. 1997, ApJ, 491, 638 [NASA ADS] [CrossRef] [Google Scholar]
- Koss, M. J., Ricci, C., Trakhtenbrot, B., et al. 2022, ApJS, 261, 2 [NASA ADS] [CrossRef] [Google Scholar]
- Lallement, R., Babusiaux, C., Vergely, J. L., et al. 2019, A&A, 625, A135 [NASA ADS] [CrossRef] [EDP Sciences] [Google Scholar]
- Lebzelter, T., Mowlavi, N., Lecoeur-Taibi, I., et al. 2023, A&A, 674, A15 [NASA ADS] [CrossRef] [EDP Sciences] [Google Scholar]
- Luna, G. J. M., Sokoloski, J. L., Mukai, K., & Nelson, T. 2013, A&A, 559, A6 [NASA ADS] [CrossRef] [EDP Sciences] [Google Scholar]
- Magaudda, E., Stelzer, B., Raetz, S., et al. 2022, A&A, 661, A29 [NASA ADS] [CrossRef] [EDP Sciences] [Google Scholar]
- Merc, J., Mikolajewska, J., Gromadzki, M., et al. 2020, A&A, 644, A49 [NASA ADS] [CrossRef] [EDP Sciences] [Google Scholar]
- Merloni, A., Predehl, P., Becker, W., et al. 2012, arXiv e-prints [arXiv:1209.3114] [Google Scholar]
- Merloni, A., Lamer, G., Liu, T., et al. 2024, A&A, 682, A34 [NASA ADS] [CrossRef] [EDP Sciences] [Google Scholar]
- Mondal, S., Ponti, G., Bao, T., et al. 2024, A&A, 686, A125 [NASA ADS] [CrossRef] [EDP Sciences] [Google Scholar]
- Morihana, K., Tsujimoto, M., Yoshida, T., & Ebisawa, K. 2013, ApJ, 766, 14 [NASA ADS] [CrossRef] [Google Scholar]
- Muno, M. P., Baganoff, F. K., Bautz, M. W., et al. 2004, ApJ, 613, 326 [NASA ADS] [CrossRef] [Google Scholar]
- Nazé, Y. 2009, A&A, 506, 1055 [NASA ADS] [CrossRef] [EDP Sciences] [Google Scholar]
- Nazé, Y., & Motch, C. 2018, A&A, 619, A148 [NASA ADS] [CrossRef] [EDP Sciences] [Google Scholar]
- Neumann, M., Avakyan, A., Doroshenko, V., & Santangelo, A. 2023, A&A, 677, A134 [NASA ADS] [CrossRef] [EDP Sciences] [Google Scholar]
- Pala, A. F., Gänsicke, B. T., Breedt, E., et al. 2020, MNRAS, 494, 3799 [Google Scholar]
- Ponti, G., Morris, M. R., Terrier, R., et al. 2015, MNRAS, 453, 172 [Google Scholar]
- Predehl, P., Andritschke, R., Arefiev, V., et al. 2021, A&A, 647, A1 [EDP Sciences] [Google Scholar]
- Pretorius, M. L., & Knigge, C. 2012, MNRAS, 419, 1442 [NASA ADS] [CrossRef] [Google Scholar]
- Pretorius, M. L., Knigge, C., & Schwope, A. D. 2013, MNRAS, 432, 570 [Google Scholar]
- Rauw, G. 2022, in Handbook of X-ray and Gamma-ray Astrophysics, eds. C. Bambi, & A. Sangangelo, 108 [Google Scholar]
- Reis, R. C., Wheatley, P. J., Gänsicke, B. T., & Osborne, J. P. 2013, MNRAS, 430, 1994 [Google Scholar]
- Revnivtsev, M., & Sazonov, S. 2007, A&A, 471, 159 [NASA ADS] [CrossRef] [EDP Sciences] [Google Scholar]
- Revnivtsev, M., Sazonov, S., Gilfanov, M., Churazov, E., & Sunyaev, R. 2006, A&A, 452, 169 [NASA ADS] [CrossRef] [EDP Sciences] [Google Scholar]
- Revnivtsev, M., Sazonov, S., Churazov, E., et al. 2009, Nature, 458, 1142 [Google Scholar]
- Rodriguez, A. C. 2024, PASP, 136, 054201 [NASA ADS] [CrossRef] [Google Scholar]
- Sazonov, S., Revnivtsev, M., Gilfanov, M., Churazov, E., & Sunyaev, R. 2006, A&A, 450, 117 [NASA ADS] [CrossRef] [EDP Sciences] [Google Scholar]
- Schmitt, J. H. M. M., Hünsch, M., Schneider, P. C., et al. 2024, A&A, 688, A9 [NASA ADS] [CrossRef] [EDP Sciences] [Google Scholar]
- Strüder, L., Briel, U., Dennerl, K., et al. 2001, A&A, 365, L18 [Google Scholar]
- Sunyaev, R., Arefiev, V., Babyshkin, V., et al. 2021, A&A, 656, A132 [NASA ADS] [CrossRef] [EDP Sciences] [Google Scholar]
- Sutherland, W., & Saunders, W. 1992, MNRAS, 259, 413 [Google Scholar]
- Tanaka, Y. 2002, A&A, 382, 1052 [NASA ADS] [CrossRef] [EDP Sciences] [Google Scholar]
- Traulsen, I., Schwope, A. D., Lamer, G., et al. 2020, A&A, 641, A137 [NASA ADS] [CrossRef] [EDP Sciences] [Google Scholar]
- Truemper, J. 1993, Science, 260, 1769 [Google Scholar]
- Turner, M. J. L., Abbey, A., Arnaud, M., et al. 2001, A&A, 365, L27 [CrossRef] [EDP Sciences] [Google Scholar]
- Waddell, S. G. H., Buchner, J., Nandra, K., et al. 2024, A&A, accepted [arXiv:2401.17306] [Google Scholar]
- Walter, F. M., & Bowyer, S. 1981, ApJ, 245, 671 [CrossRef] [Google Scholar]
- Wang, Q. D. 2021, MNRAS, 504, 1609 [CrossRef] [Google Scholar]
- Wang, S., & Chen, X. 2019, ApJ, 877, 116 [Google Scholar]
- Wilms, J., Allen, A., & McCray, R. 2000, ApJ, 542, 914 [Google Scholar]
- Worrall, D. M., & Marshall, F. E. 1983, ApJ, 267, 691 [NASA ADS] [CrossRef] [Google Scholar]
- Yamamoto, K., Yamauchi, S., Nobukawa, M., Nobukawa, K. K., & Uchiyama, H. 2023, PASJ, 75, 522 [Google Scholar]
- Yuasa, T., Nakazawa, K., Makishima, K., et al. 2010, A&A, 520, A25 [NASA ADS] [CrossRef] [EDP Sciences] [Google Scholar]
Most of the matched pairs (95%, 139 of 146) have separations within 3σ (∼2.67″) of the mean separation between Gaia and XMM-Newton.
Appendix A Source catalog with X-ray spectral properties and classifications
eRASS1 source properties and classifications (extract; the full table is available at the CDS).
Appendix B X-ray spectra plots for selected exotic sources
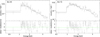 |
Fig. B.1 Spectra with the best-fitted model for the two γ CAS candidates. |
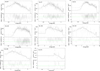 |
Fig. B.2 Spectra with the best-fitted model for the eight CV candidates. |
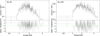 |
Fig. B.3 Spectra with the best-fitted model for the two SySt candidates. |
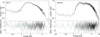 |
Fig. B.4 Spectra with the best-fitted model for the two isolated NSs. |
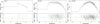 |
Fig. B.5 Spectra with the best-fitted model for the three LMXB candidates. |
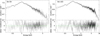 |
Fig. B.6 Spectra with the best-fitted model for the two RS CVn systems. |
All Tables
eRASS1 source properties and classifications (extract; the full table is available at the CDS).
All Figures
|
Fig. 1 Positional uncertainty comparison of eRASS1 and XMM-Newton sources. This histogram shows the 1σ positional uncertainties for sources in the eRASS1 (black) and XMM-Newton (green) catalogs. |
| In the text | |
|
Fig. 2 Angular separation between the eRASS1 sources and the nearest XMM-Newton sources. The prominent bimodal distribution indicates a natural separation threshold at approximately ∼16.3″, which we used to distinguish true associations from random alignments. |
| In the text | |
|
Fig. 3 Results of cross-matching eRASS1 and XMM sources. Among the 189 eRASS1 sources within the XMM-Newton footprint, 158 have reliable XMM counterparts. The remaining 31 are categorized as potentially extended sources, source confusion in crowded regions, transient candidates, or stray light contamination/Galactic center sources and thus not included in the XMM filtered catalog. |
| In the text | |
|
Fig. 4 Angular separation distributions for matched eRASS1, XMM-Newton, and Gaia sources. Histograms (top and right panels) display eRASS1-Gaia and XMM-Gaia separations, respectively. Rayleigh fits (dashed red lines) yield characteristic uncertainties of σsep = 3.44″ for eRASS1-Gaia pairs and σsep = 0.89″ for XMM-Gaia pairs. Main panel: eRASS1-Gaia versus XMM-Gaia separation, with the y=x equality shown as a dashed black line. Good HamStar matches are blue dots. Bad HamStar matches are red dots, and their source indices are provided. Sources without a HamStar match are represented by dark gray dots, and indices of vertical outliers (XMM-Gaia separations > 4″ ) are labeled in black. |
| In the text | |
|
Fig. 5 Gaia matching results for the 158 XMM-Newton-detected eRASS1 sources. |
| In the text | |
|
Fig. 6 XMM-Newton flux and thermal temperature distributions. Top: 0.2-10 keV unabsorbed X-ray flux versus the APEC best-fit temperature (kT) for different source classes. Bottom: histogram of the best-fit mean temperatures for each category. |
| In the text | |
|
Fig. 7 X-ray main sequence diagram: X-ray-to-optical flux ratio (FX/Fopt) against Gaia BP-RP color. The solid line shows the empirical boundary separating accreting compact objects from coronal sources. Labels indicate sources beyond the empirical cut. Low-confidence matches are indicated by open black circles. |
| In the text | |
|
Fig. 8 Gaia Hertzsprung-Russell diagram for sources with distance estimates. The x-axis shows the Gaia BP-RP color, and the y-axis shows the absolute G-band magnitude. The color bar indicates the unabsorbed 0.2-10 keV X-ray luminosity. Overplotted are PARSEC isochrones for stellar populations of 40 Myr (blue) and 4 Gyr (red). Sources above the empirical cut in the X-ray main sequence diagram are labeled with black source IDs, while two γ Cas candidates are marked in red. Two extremely “red” outliers are marked as SySt candidates. Low-confidence matches are shown as open black circles. |
| In the text | |
|
Fig. 9 Source classification of 158 XMM-Newton-detected eRASS1 sources. |
| In the text | |
|
Fig. 10 HR versus flux for eRASS1 Galactic plane sources. Upper panel: HR against the 0.2-8 keV flux for eRASS1 sources within |b| < 1°. The vertical dashed line represents an empirical cut at HR=-0.2. Known Galactic LMXBs and HMXBs from Avakyan et al. (2023) and Neumann et al. (2023) are indicated by blue and orange squares, respectively. Lower panel: HR histograms for different source categories. |
| In the text | |
|
Fig. 11 HR versus 0.2-10 keV flux from XMM spectral fitting. Upper panel: HR against 0.2-8 keV flux. The vertical dashed line represents the empirical cut at HR=-0.2. Lower panel: HR distributions for different source classes. |
| In the text | |
|
Fig. 12 Stacked X-ray spectra of classified source populations from the eRASS1 sample (colored lines), compared to the GRXE surface brightness (black points) in five broad energy bands. The summed spectrum of all classified point sources is shown as orange squares. |
| In the text | |
|
Fig. B.1 Spectra with the best-fitted model for the two γ CAS candidates. |
| In the text | |
|
Fig. B.2 Spectra with the best-fitted model for the eight CV candidates. |
| In the text | |
|
Fig. B.3 Spectra with the best-fitted model for the two SySt candidates. |
| In the text | |
|
Fig. B.4 Spectra with the best-fitted model for the two isolated NSs. |
| In the text | |
|
Fig. B.5 Spectra with the best-fitted model for the three LMXB candidates. |
| In the text | |
|
Fig. B.6 Spectra with the best-fitted model for the two RS CVn systems. |
| In the text | |
Current usage metrics show cumulative count of Article Views (full-text article views including HTML views, PDF and ePub downloads, according to the available data) and Abstracts Views on Vision4Press platform.
Data correspond to usage on the plateform after 2015. The current usage metrics is available 48-96 hours after online publication and is updated daily on week days.
Initial download of the metrics may take a while.