Fig. 8
Download original image
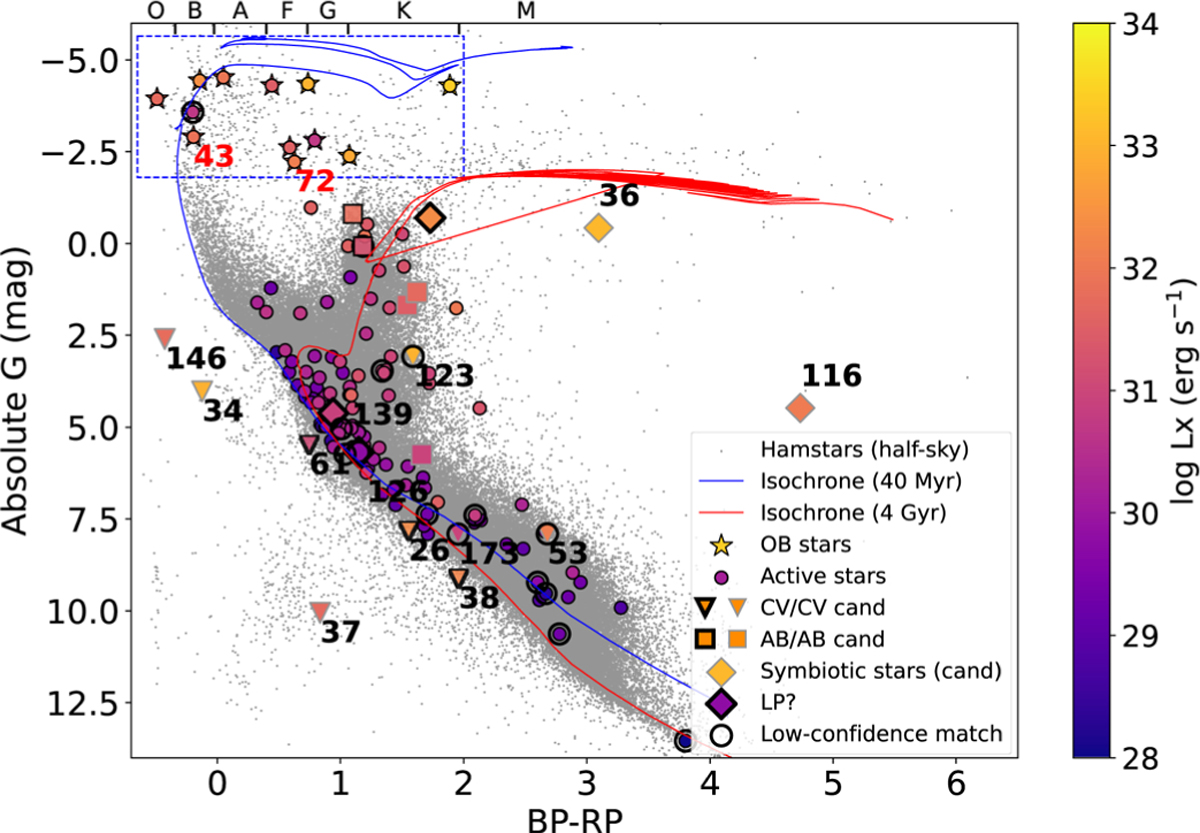
Gaia Hertzsprung-Russell diagram for sources with distance estimates. The x-axis shows the Gaia BP-RP color, and the y-axis shows the absolute G-band magnitude. The color bar indicates the unabsorbed 0.2-10 keV X-ray luminosity. Overplotted are PARSEC isochrones for stellar populations of 40 Myr (blue) and 4 Gyr (red). Sources above the empirical cut in the X-ray main sequence diagram are labeled with black source IDs, while two γ Cas candidates are marked in red. Two extremely “red” outliers are marked as SySt candidates. Low-confidence matches are shown as open black circles.
Current usage metrics show cumulative count of Article Views (full-text article views including HTML views, PDF and ePub downloads, according to the available data) and Abstracts Views on Vision4Press platform.
Data correspond to usage on the plateform after 2015. The current usage metrics is available 48-96 hours after online publication and is updated daily on week days.
Initial download of the metrics may take a while.