Fig. 1.
Download original image
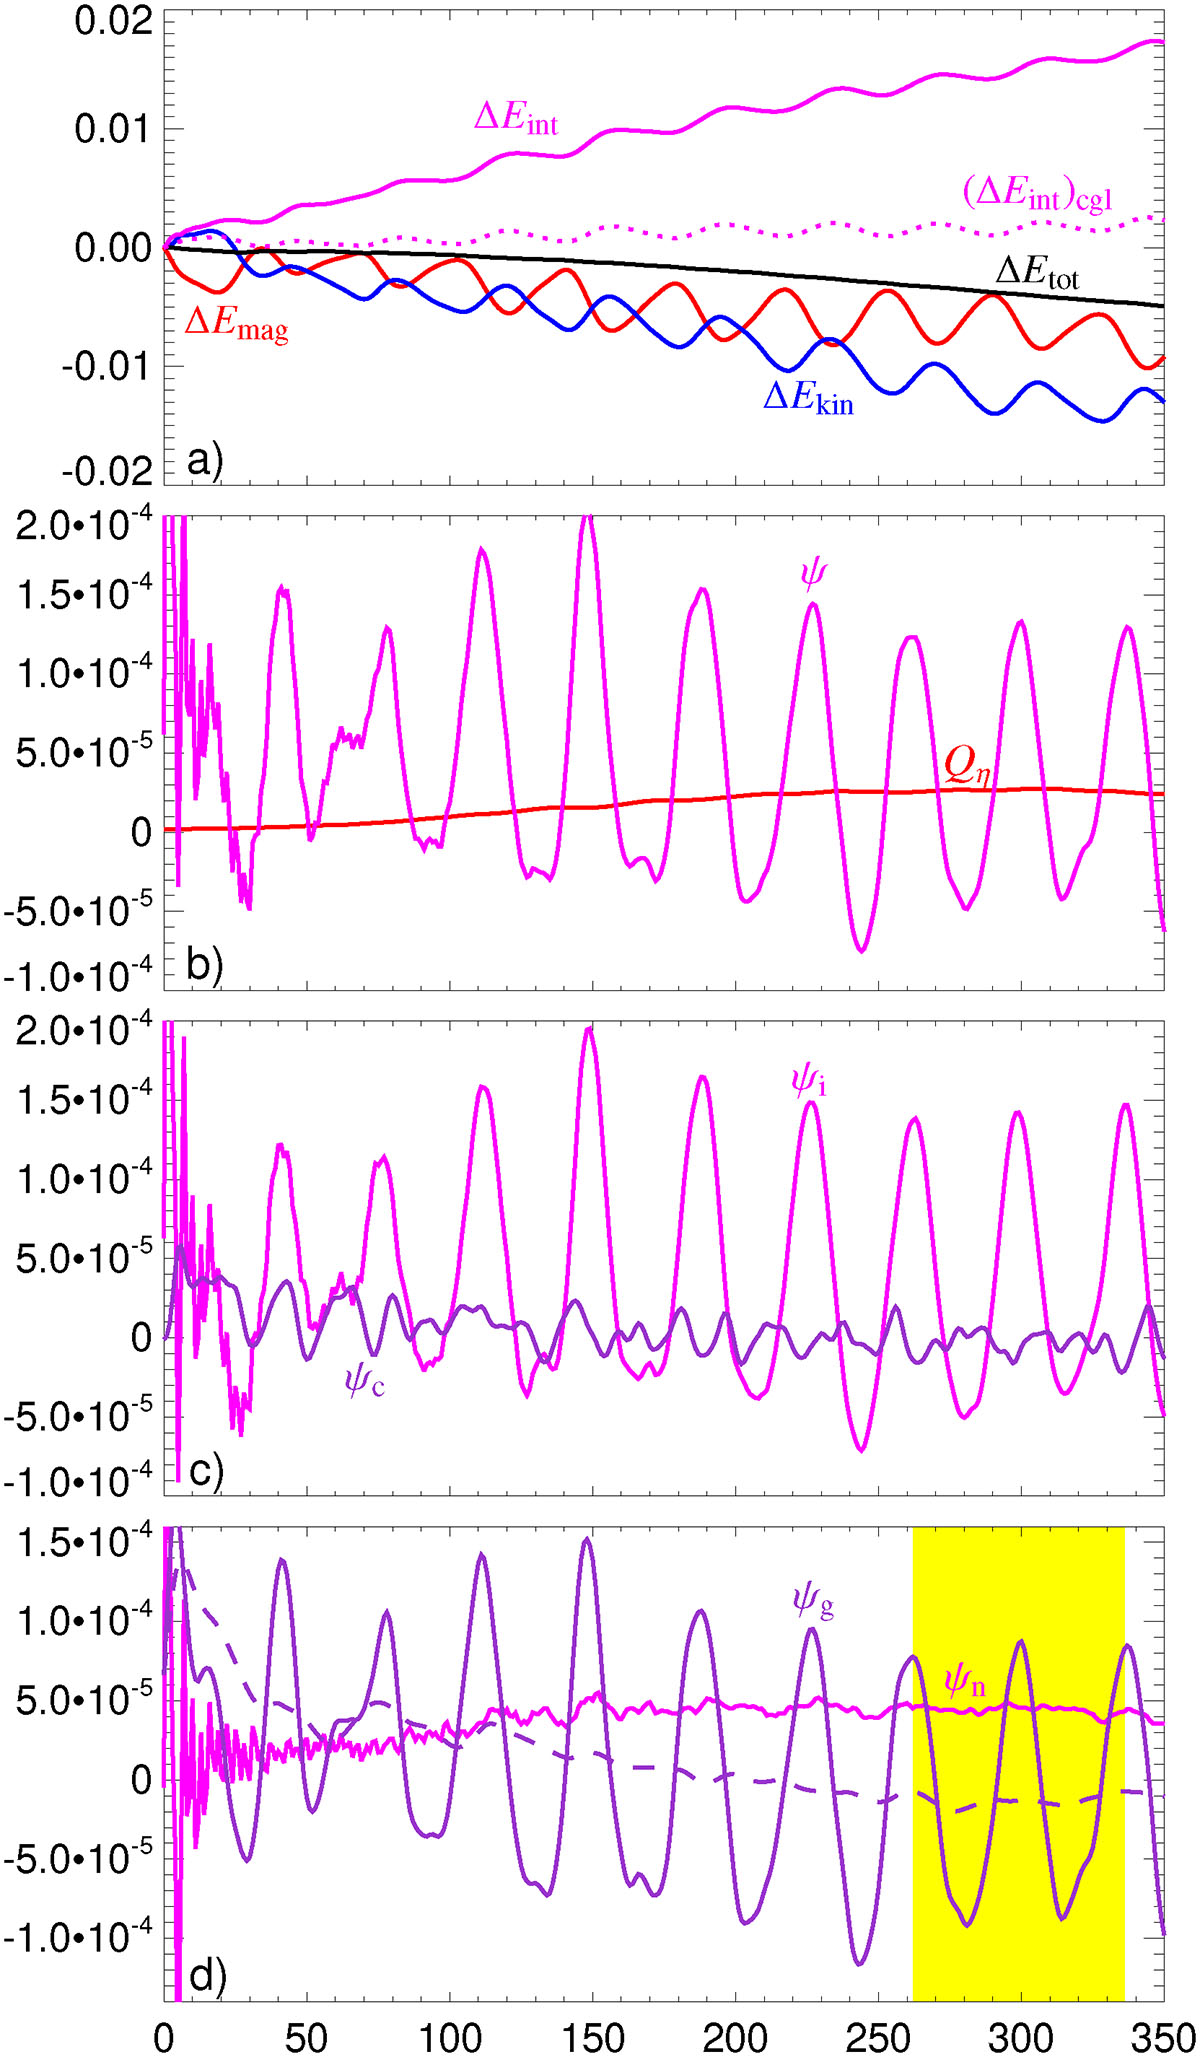
Evolution of different quantities as a function of time. (a) Relative changes in the kinetic energy ΔEkin (blue), magnetic energy ΔEmag (red), internal energy ΔEint (magenta), and total energy ΔEtot (black). The dotted magenta line shows a simple double adiabatic prediction for the internal energy (ΔEint)cgl. (b) Pressure-strain rate ψ (magenta) and resistive dissipation rate Qη (red). (c) (Magenta) Non-compressive and (purple) compressive parts of the pressure-strain rate, ψi and ψc, respectively. (d) (Magenta) Non-gyrotropic and (purple) gyrotropic parts of the pressure-strain rate, ψn and ψg, respectively. The dashed purple line shows the running average of ψg. The yellow region in panel d denotes the time interval of two periods of pressure-strain rate oscillations for further reference.
Current usage metrics show cumulative count of Article Views (full-text article views including HTML views, PDF and ePub downloads, according to the available data) and Abstracts Views on Vision4Press platform.
Data correspond to usage on the plateform after 2015. The current usage metrics is available 48-96 hours after online publication and is updated daily on week days.
Initial download of the metrics may take a while.