Fig. 8.
Download original image
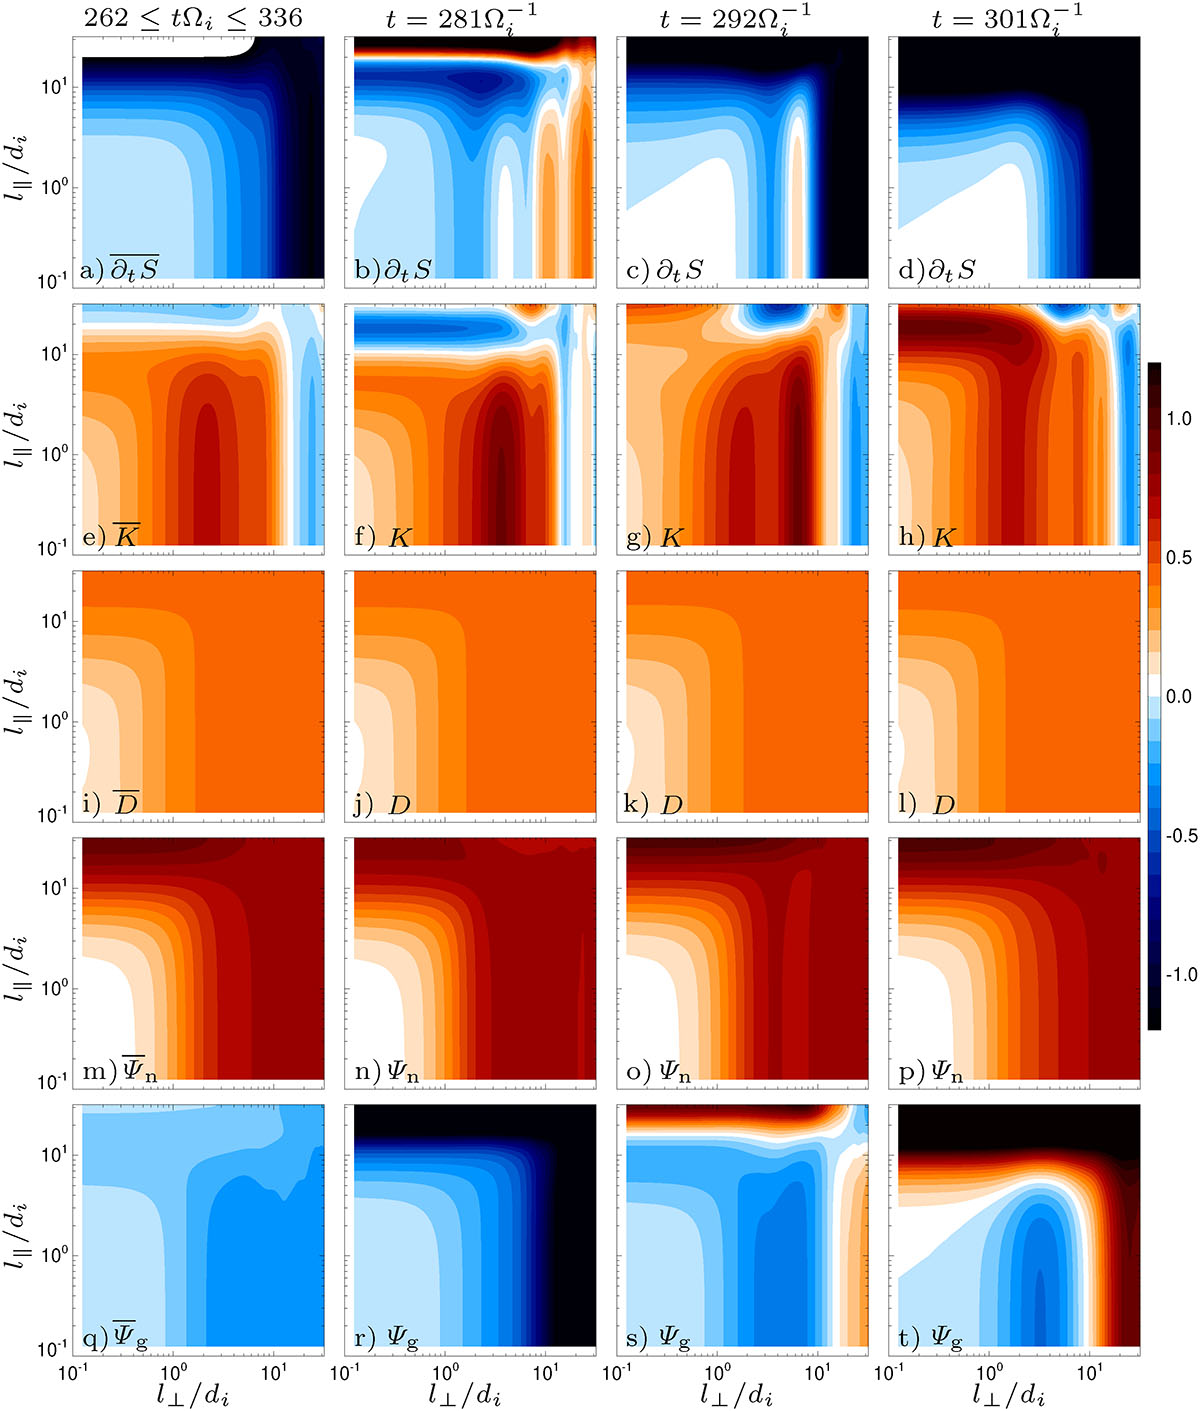
Anisotropic KHM results. Colour-scale plots of different quantities (normalised to the time-averaged effective total dissipation rate ![]() ) as a function of the separation scales l⊥ and l∥ (left panels) averaged over 262 ≤ tΩi ≤ 336 and at three different times (left middle panels) t = 281Ωi−1, (right middle panels) t = 292Ωi−1 and (right panels) t = 301Ωi−1: (a–d) Decay rate ∂tS, (e–h) cascade rate K, (i–l) resistive dissipation term D, and (m–p) the non-gyrotropic pressure-strain term Ψn, and (q–t) gyrotropic pressure-strain term Ψg. The overline denotes (time-)averaged quantities. The colour-scale for all the quantities is shown at the right.
) as a function of the separation scales l⊥ and l∥ (left panels) averaged over 262 ≤ tΩi ≤ 336 and at three different times (left middle panels) t = 281Ωi−1, (right middle panels) t = 292Ωi−1 and (right panels) t = 301Ωi−1: (a–d) Decay rate ∂tS, (e–h) cascade rate K, (i–l) resistive dissipation term D, and (m–p) the non-gyrotropic pressure-strain term Ψn, and (q–t) gyrotropic pressure-strain term Ψg. The overline denotes (time-)averaged quantities. The colour-scale for all the quantities is shown at the right.
Current usage metrics show cumulative count of Article Views (full-text article views including HTML views, PDF and ePub downloads, according to the available data) and Abstracts Views on Vision4Press platform.
Data correspond to usage on the plateform after 2015. The current usage metrics is available 48-96 hours after online publication and is updated daily on week days.
Initial download of the metrics may take a while.