Fig. 1
Download original image
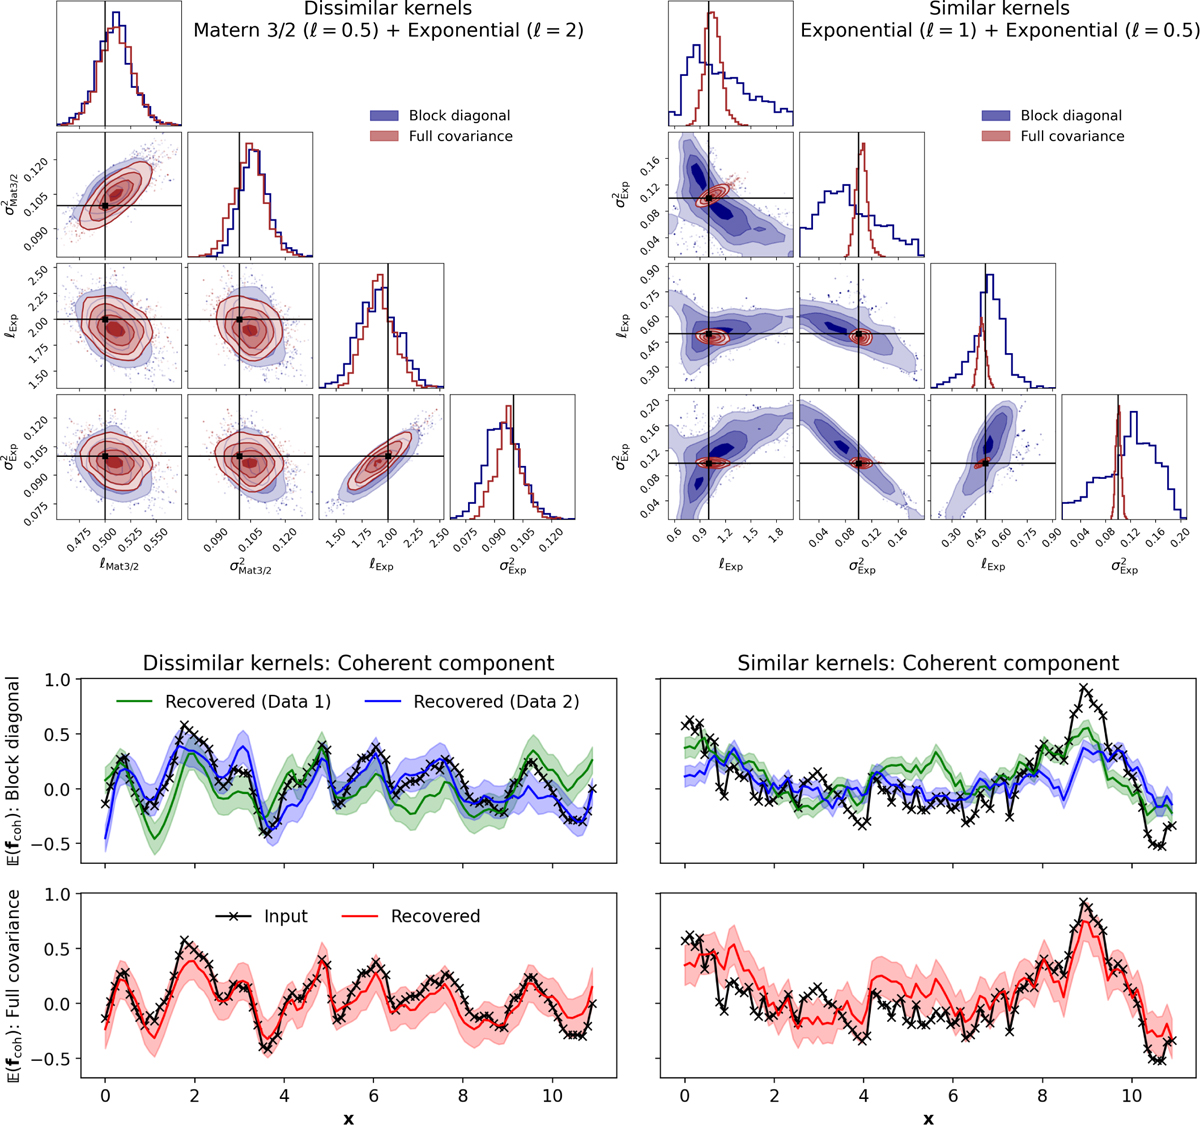
Impact of including cross-covariances in GPR in the separation of coherent and incoherent components demonstrated on synthetic data. The left column shows the case where the coherent and incoherent covariance kernels are distinct, while the right column shows the case of the coherent and incoherent components having similar covariances. The corner plots in the top show the posterior distribution of the hyperparameters for the block diagonal approach (in blue) and the full covariance approach (in red). The four plots at the bottom show the recovery of a single realisation of the coherent component, for the block diagonal and full covariance approaches, respectively.
Current usage metrics show cumulative count of Article Views (full-text article views including HTML views, PDF and ePub downloads, according to the available data) and Abstracts Views on Vision4Press platform.
Data correspond to usage on the plateform after 2015. The current usage metrics is available 48-96 hours after online publication and is updated daily on week days.
Initial download of the metrics may take a while.