Fig. 5
Download original image
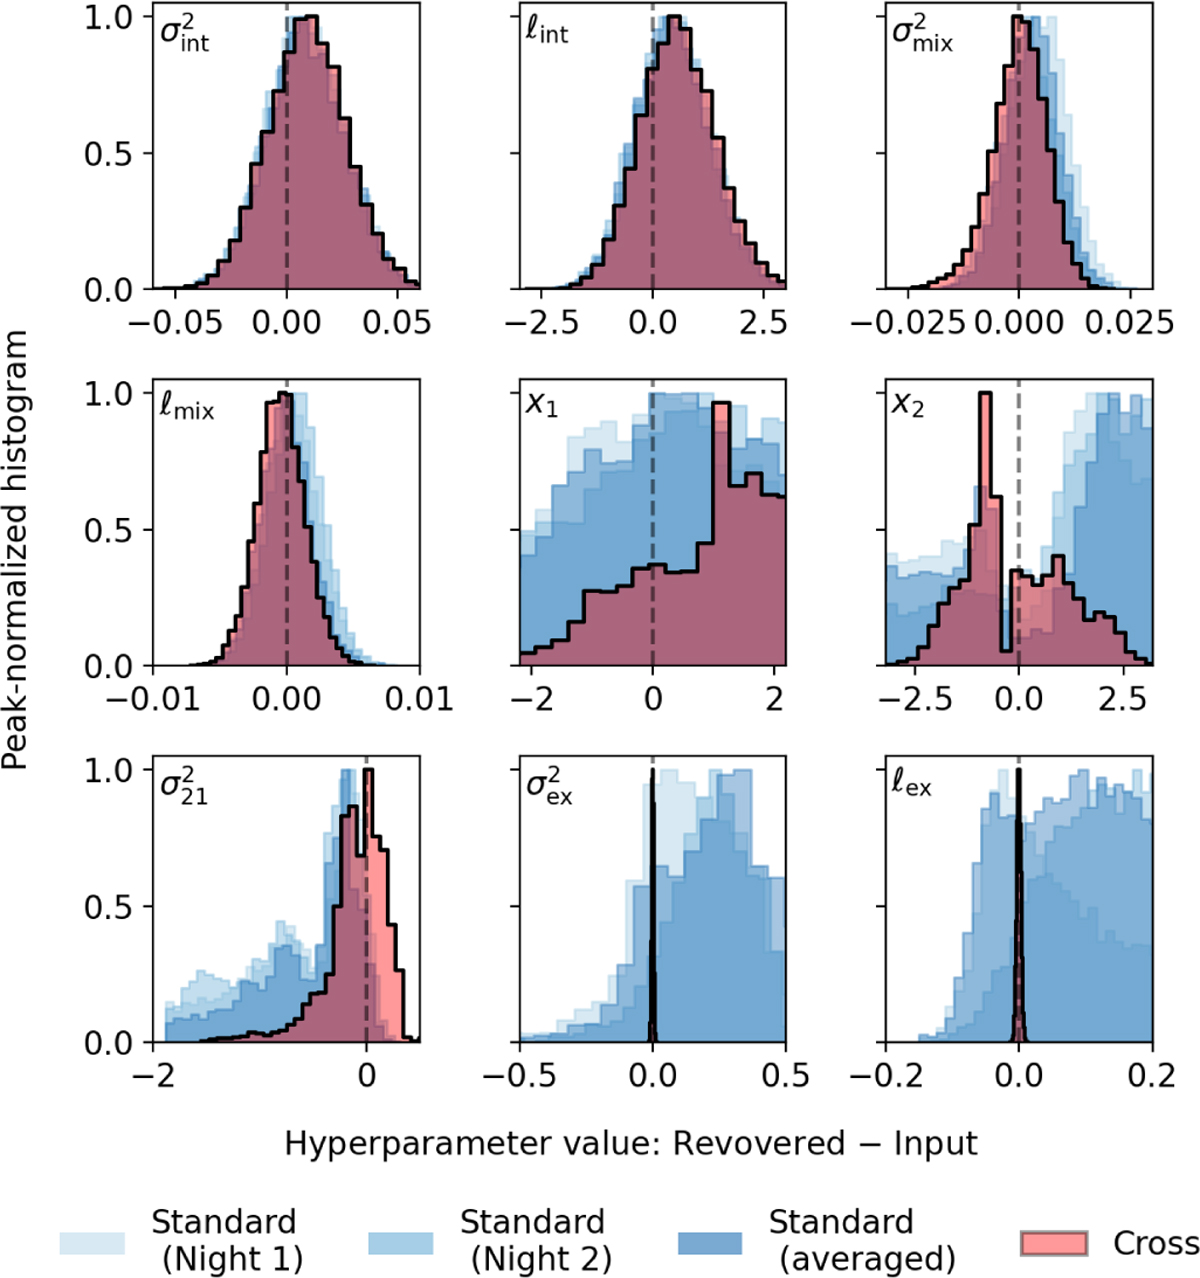
Recovery of the input hyperparameters for simulations performed for a variety of 21 cm signal shapes. The peak-normalised histograms marginalised over all signal shapes, computed after subtracting the input values, are shown. The different panels correspond to the different hyperparameters. The results from the three runs of standard GPR are shown in different shades of blue, while the cross-GPR results are shown in red. A vertical line is plotted at Recovered = Input to indicate perfect recovery.
Current usage metrics show cumulative count of Article Views (full-text article views including HTML views, PDF and ePub downloads, according to the available data) and Abstracts Views on Vision4Press platform.
Data correspond to usage on the plateform after 2015. The current usage metrics is available 48-96 hours after online publication and is updated daily on week days.
Initial download of the metrics may take a while.