Fig. 6
Download original image
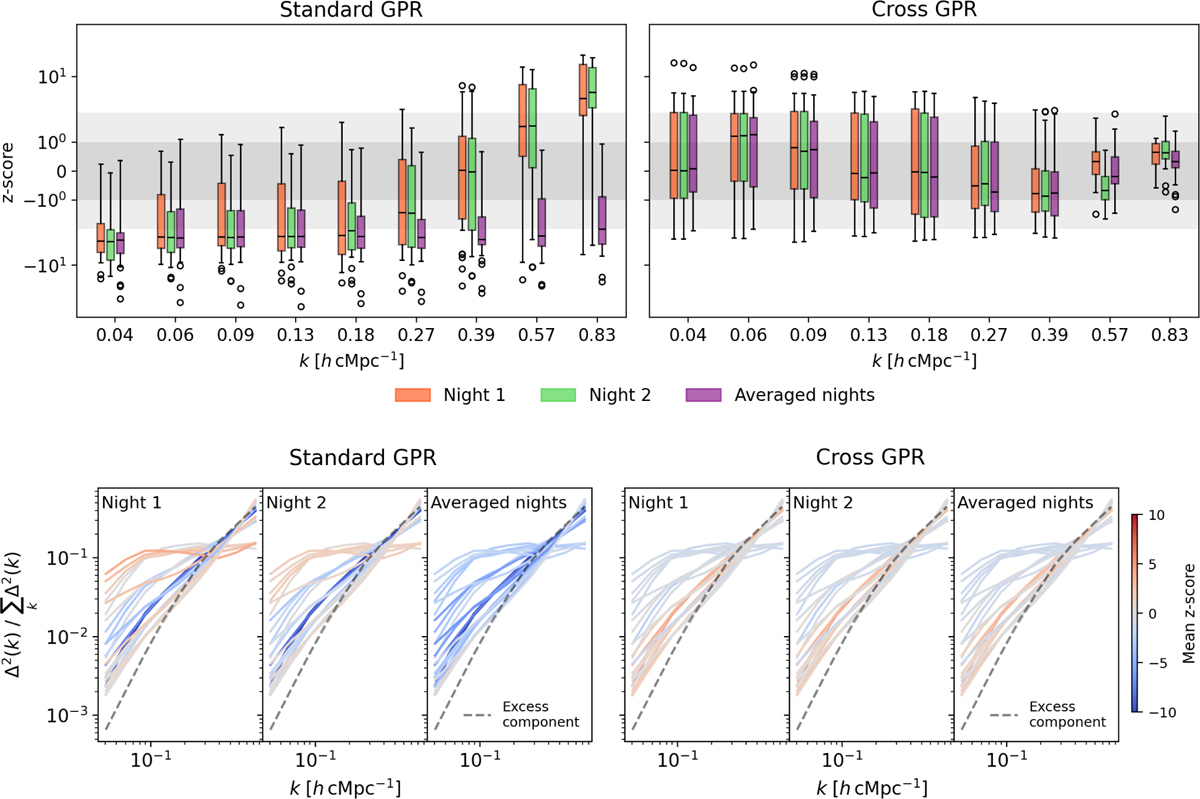
Distribution of z-scores for simulations performed for a variety of 21 cm signal shapes. The two columns show the results for standard and cross-GPR. The top panel shows the dependence of the z-score on k, for the different nights. The gray bands indicate the 1σ and 2σ levels. The bottom panel shows the dependence of the mean z-score on the 21 cm signal shape. The normalised power spectra for the different signal shapes are shown with colors indicating the mean z-score. The shape of the excess component power spectrum is indicated in each panel with dashed black lines.
Current usage metrics show cumulative count of Article Views (full-text article views including HTML views, PDF and ePub downloads, according to the available data) and Abstracts Views on Vision4Press platform.
Data correspond to usage on the plateform after 2015. The current usage metrics is available 48-96 hours after online publication and is updated daily on week days.
Initial download of the metrics may take a while.