Fig. C.1.
Download original image
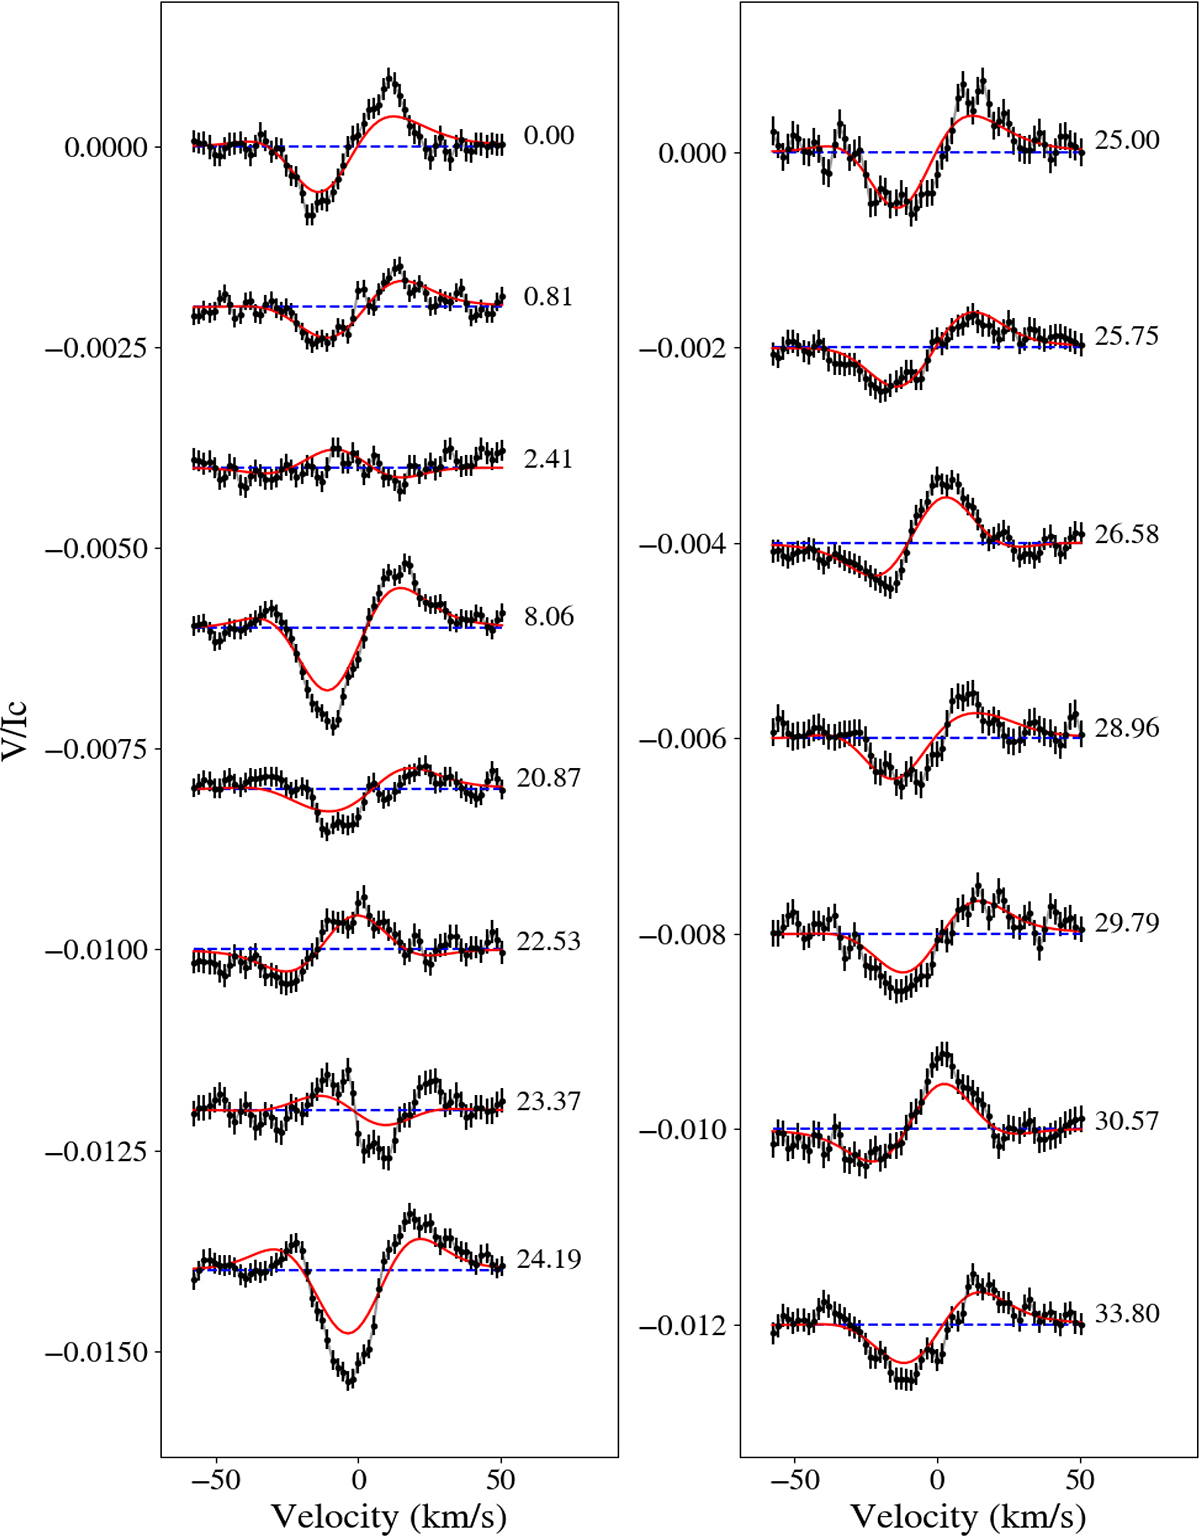
Time series of Stokes V LSD profiles and the ZDI models for StKM 1-1262. The observations are shown in black and the models in red. The numbers on the right indicate the rotational cycle computed from Eq. 1 using the first observation of an epoch as reference date. The horizontal line represents the zero point of the profiles, which are shifted vertically based on their rotational phase for visualisation purposes.
Current usage metrics show cumulative count of Article Views (full-text article views including HTML views, PDF and ePub downloads, according to the available data) and Abstracts Views on Vision4Press platform.
Data correspond to usage on the plateform after 2015. The current usage metrics is available 48-96 hours after online publication and is updated daily on week days.
Initial download of the metrics may take a while.