Open Access
Fig. 4.
Download original image
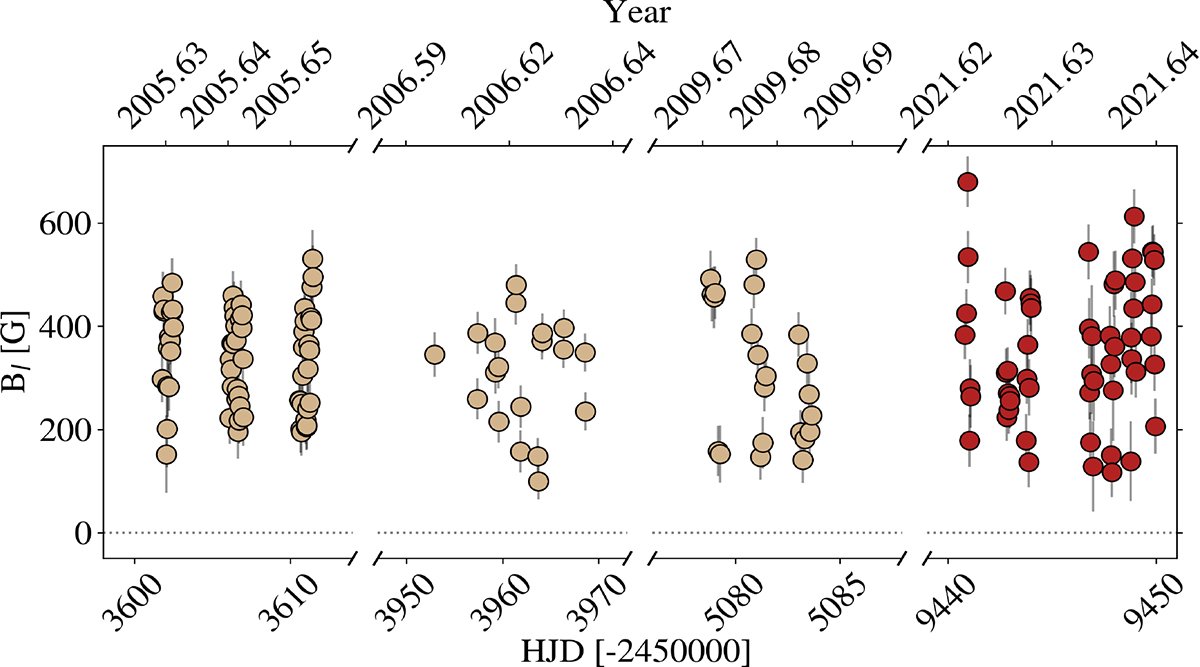
Long-term measurements of V374 Peg’s longitudinal magnetic field. The leftmost epochs (coloured with light brown) represent the August 2005, August 2006, and September 2009 time series analysed by Morin et al. (2008a). The rightmost (dark brown) time series corresponds to the data analysed in this work.
Current usage metrics show cumulative count of Article Views (full-text article views including HTML views, PDF and ePub downloads, according to the available data) and Abstracts Views on Vision4Press platform.
Data correspond to usage on the plateform after 2015. The current usage metrics is available 48-96 hours after online publication and is updated daily on week days.
Initial download of the metrics may take a while.