Fig. 5.
Download original image
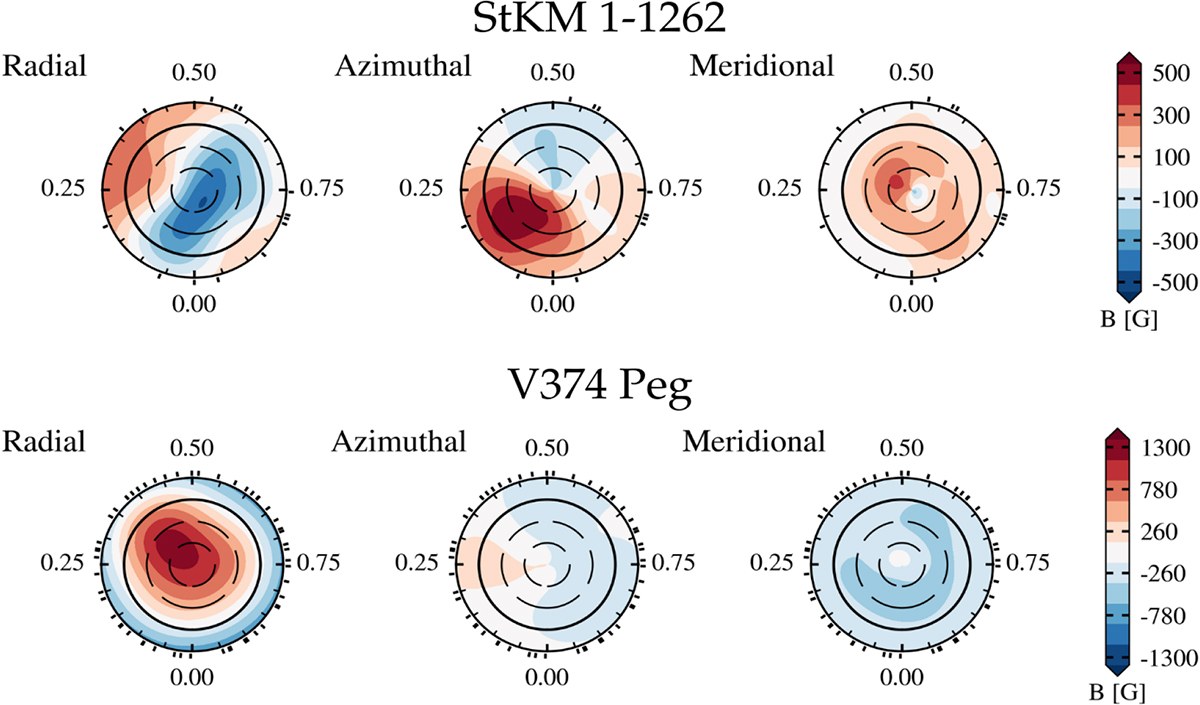
Reconstructed large-scale magnetic field maps in flattened polar view. StKM 1-1262 is shown in the top row and V374 Peg in the bottom row. From the left, the radial, azimuthal, and meridional components of the magnetic field vector are illustrated. Concentric circles represent different stellar latitudes: −30 °, +30 °, and +60 ° (dashed lines), as well as the equator (solid line). The radial ticks are located at the rotational phases when the observations were collected. The rotational phases are computed with Eq. (1), using the first observation of each individual epoch (see Table A.1). The colour bar indicates the polarity and strength (in G) of the magnetic field.
Current usage metrics show cumulative count of Article Views (full-text article views including HTML views, PDF and ePub downloads, according to the available data) and Abstracts Views on Vision4Press platform.
Data correspond to usage on the plateform after 2015. The current usage metrics is available 48-96 hours after online publication and is updated daily on week days.
Initial download of the metrics may take a while.