Fig. 6.
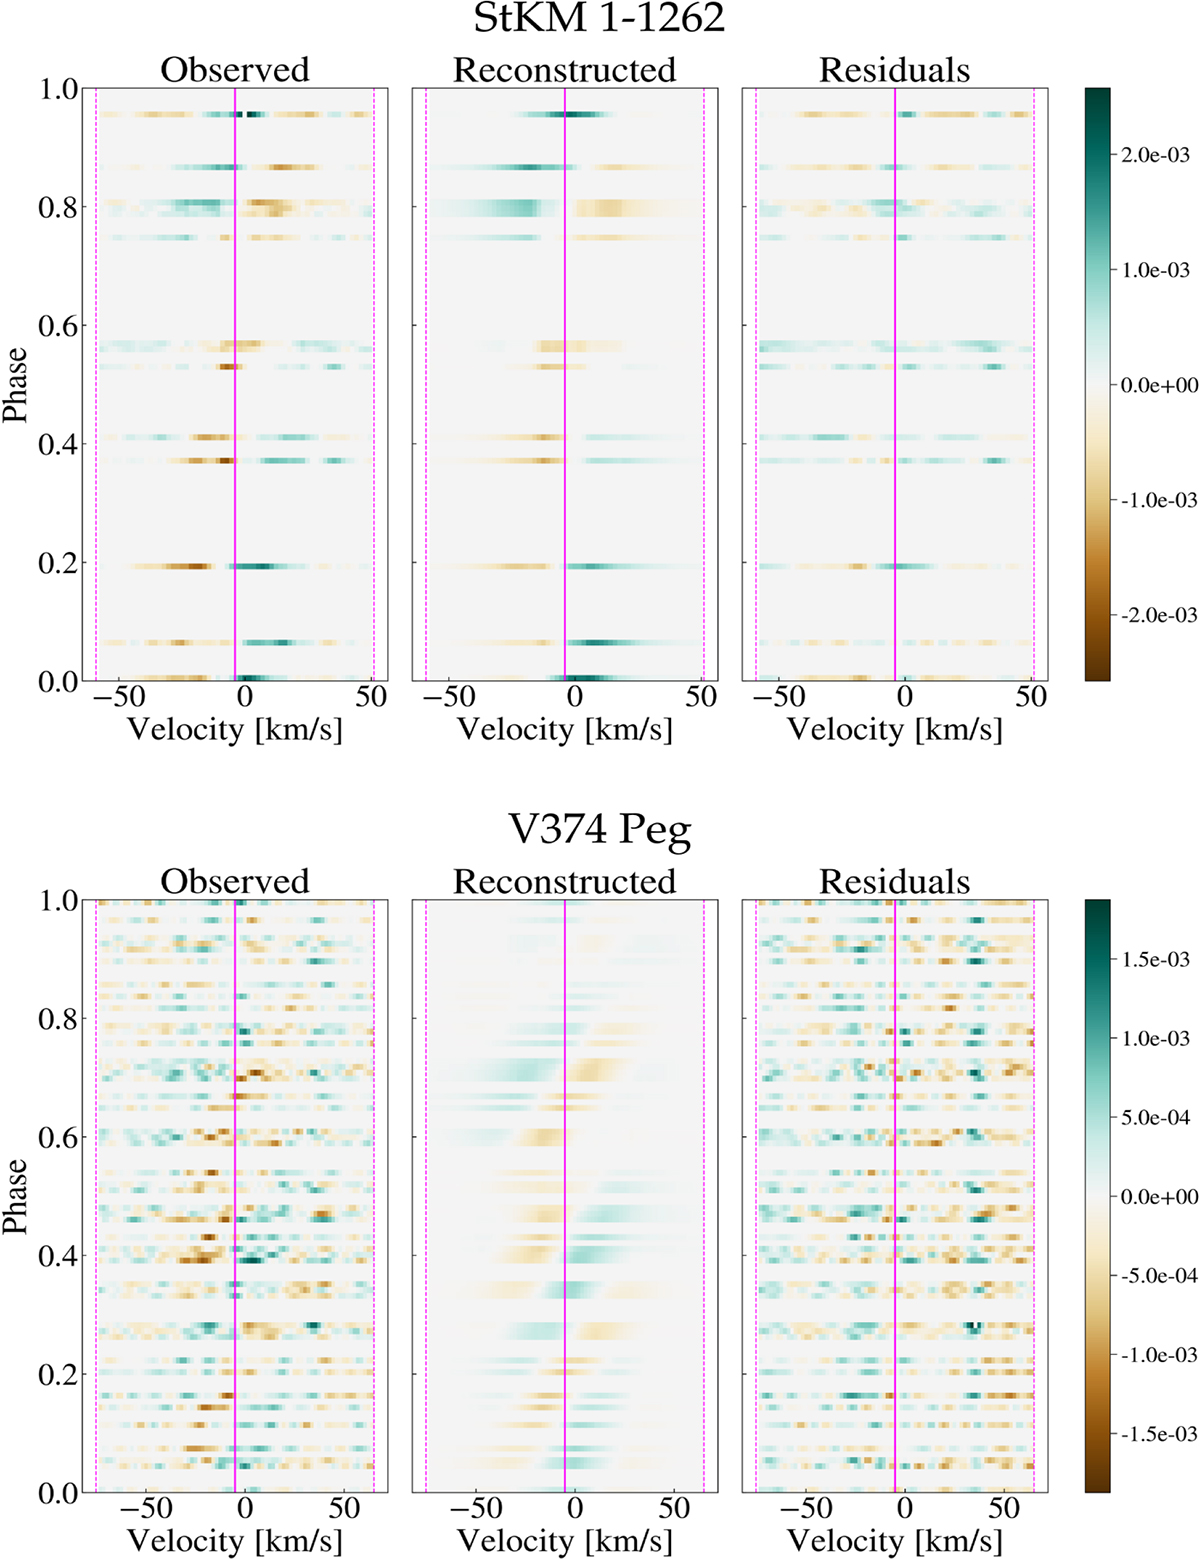
Download original image
Dynamic spectra of StKM 1-1262 and V374 Peg. The Stokes I profiles are phase-folded according to Eq. (1) and stacked vertically. From left, the panels show the observed, reconstructed and residual profiles. The colour bar indicates the flux values of Stokes I LSD profiles. In the observed and reconstructed panels, the Stokes I are median subtracted, hence positive and negative values of the colour bar indicate dark and bright features, respectively. The median subtraction removes stationary bumps, making them more evident in the residuals panel. The vertical solid line locates the radial velocity of the stars (−3.9 km s−1 for StKM 1-1262 and −5.0 km s−1 for V374 Peg), and the two dashed lines are located at the extremes of the intervals for the computation of Bℓ and ZDI (see Sect. 4 and Sect. 5).
Current usage metrics show cumulative count of Article Views (full-text article views including HTML views, PDF and ePub downloads, according to the available data) and Abstracts Views on Vision4Press platform.
Data correspond to usage on the plateform after 2015. The current usage metrics is available 48-96 hours after online publication and is updated daily on week days.
Initial download of the metrics may take a while.