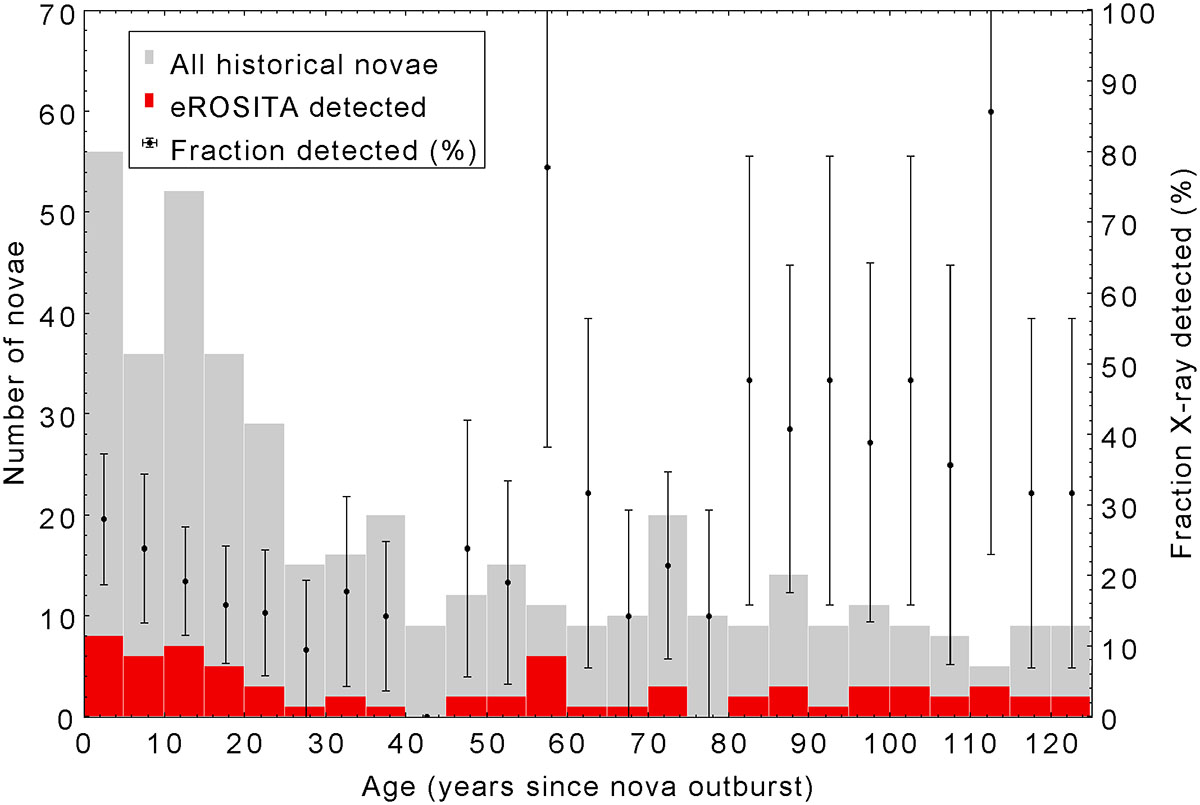
Fig. 1.
Download original image
Total number of historical novae (grey bars), novae detected by eROSITA (red bars), and the fraction of eROSITA X-ray detected novae (black bullets, auxiliary right vertical axis) as a function of years since the last nova outburst. eROSITA detections include eRASS:4 DE (this work) as well as detections reported by Galiullin & Gilfanov (2021).
Current usage metrics show cumulative count of Article Views (full-text article views including HTML views, PDF and ePub downloads, according to the available data) and Abstracts Views on Vision4Press platform.
Data correspond to usage on the plateform after 2015. The current usage metrics is available 48-96 hours after online publication and is updated daily on week days.
Initial download of the metrics may take a while.