Open Access
Fig. 2
Download original image
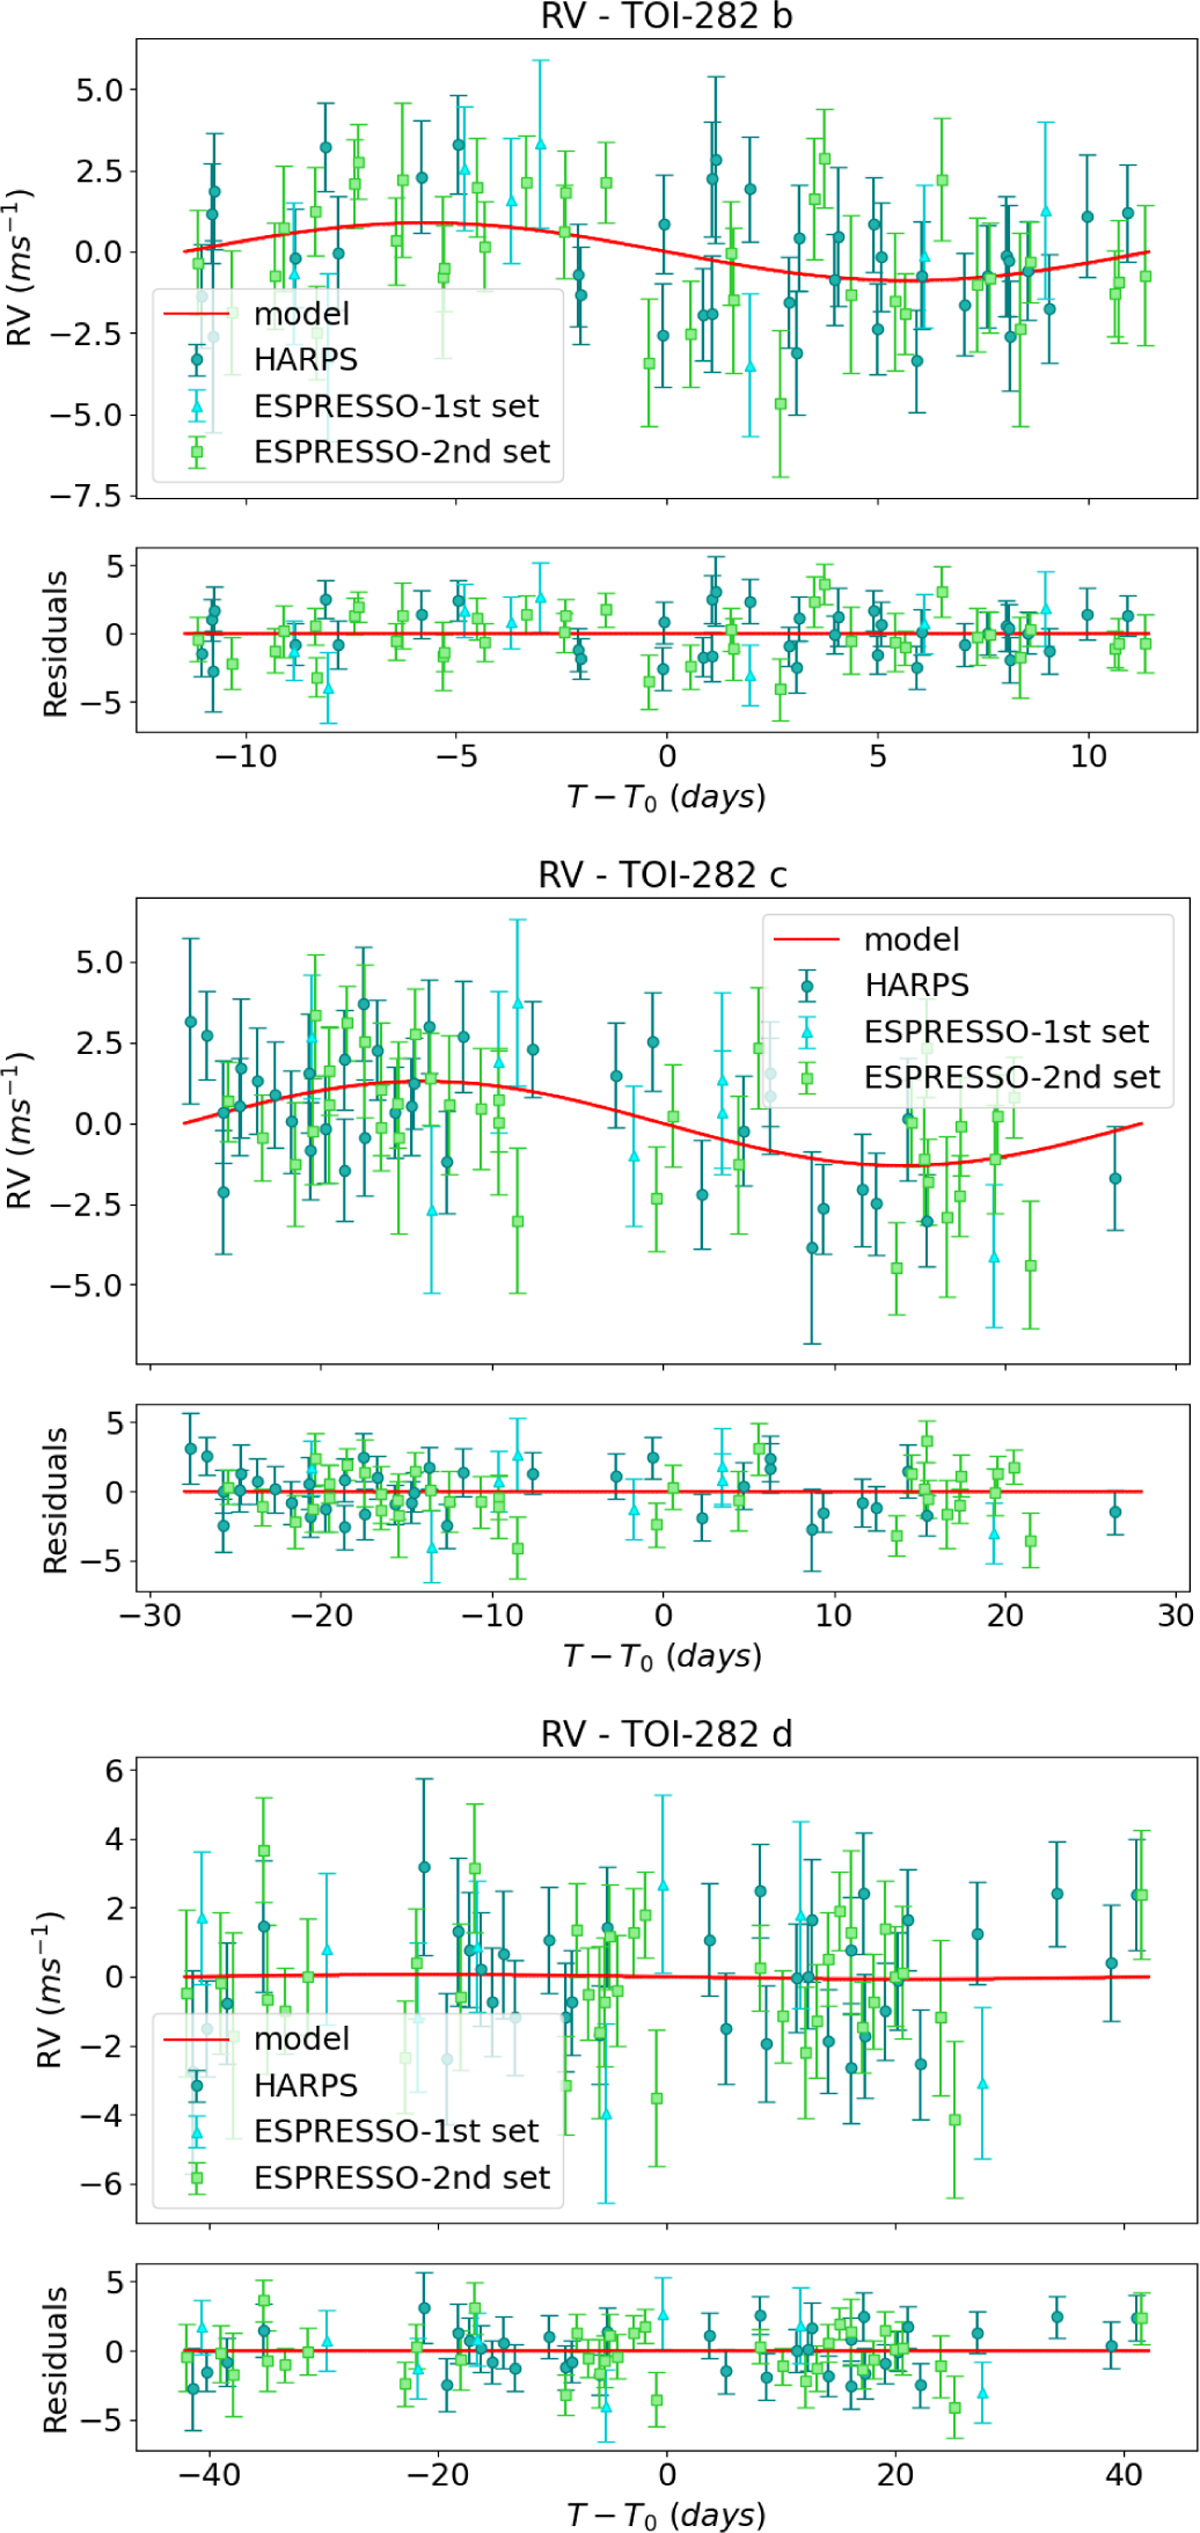
From top to bottom: folded RV stellar signals induced by TOI-282 b, c, and d, and best-fitting RV models (red curve). The data includes 37 HARPS spectra (blue circular points) and 8 + 36 ESPRESSO spectra (cyan triangular and green square points, respectively). The lower panels show the residuals to the models.
Current usage metrics show cumulative count of Article Views (full-text article views including HTML views, PDF and ePub downloads, according to the available data) and Abstracts Views on Vision4Press platform.
Data correspond to usage on the plateform after 2015. The current usage metrics is available 48-96 hours after online publication and is updated daily on week days.
Initial download of the metrics may take a while.