Open Access
Fig. 3
Download original image
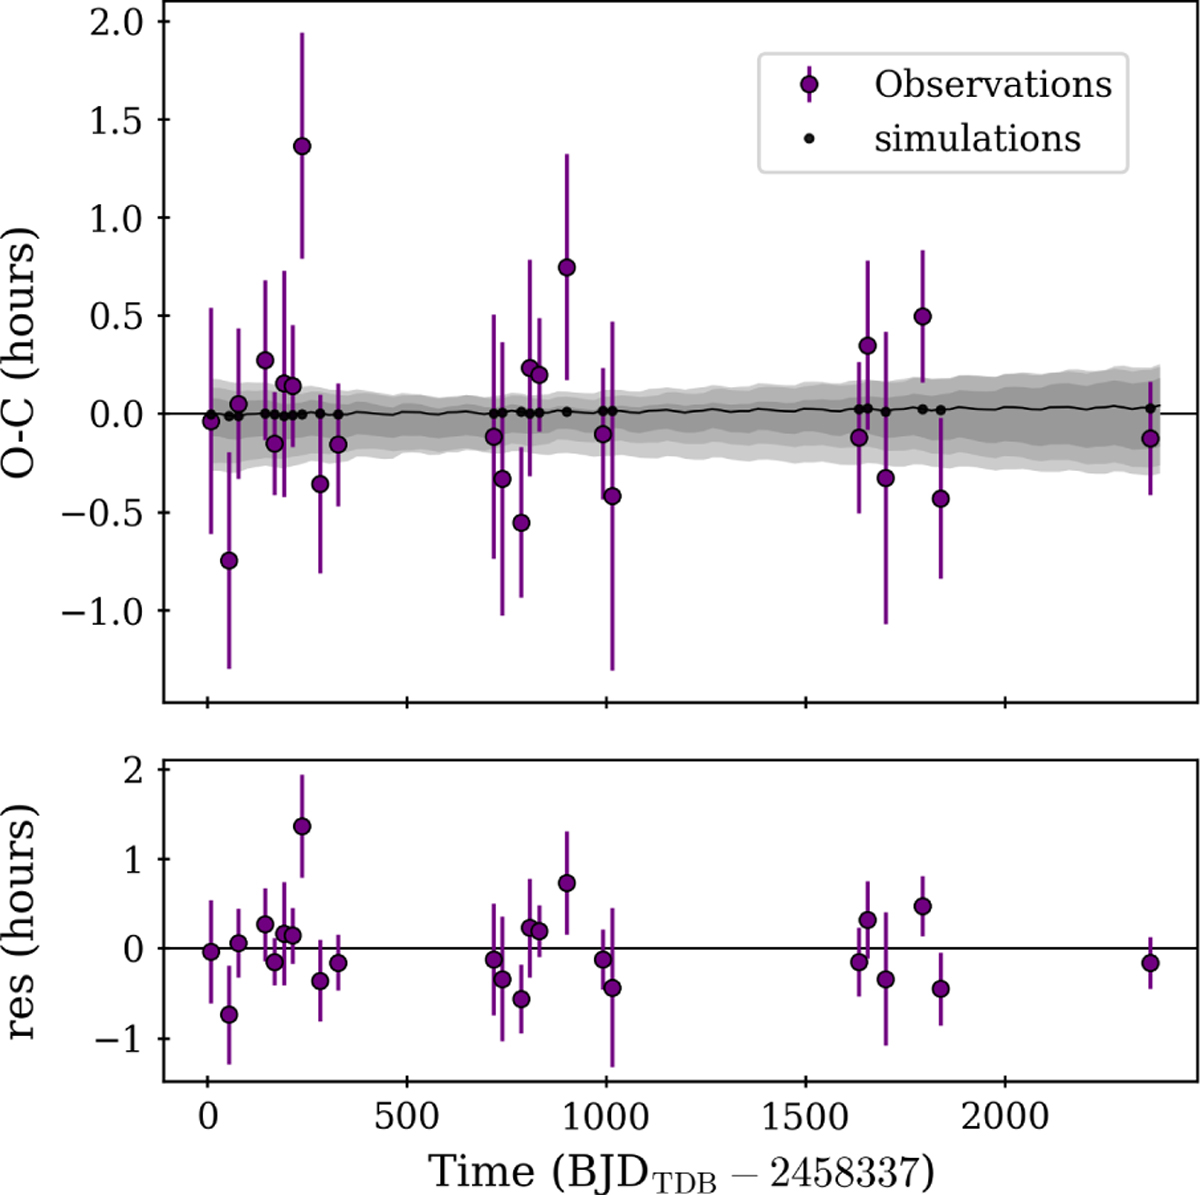
Observed minus calculated (O–C) TTV diagram for TOI-282b, showing TTV as a function of time. The shaded regions represent the 1,2, and 3σ confidence interval derived from the posterior distributions of the model parameters of our dynamical analysis.
Current usage metrics show cumulative count of Article Views (full-text article views including HTML views, PDF and ePub downloads, according to the available data) and Abstracts Views on Vision4Press platform.
Data correspond to usage on the plateform after 2015. The current usage metrics is available 48-96 hours after online publication and is updated daily on week days.
Initial download of the metrics may take a while.