Open Access
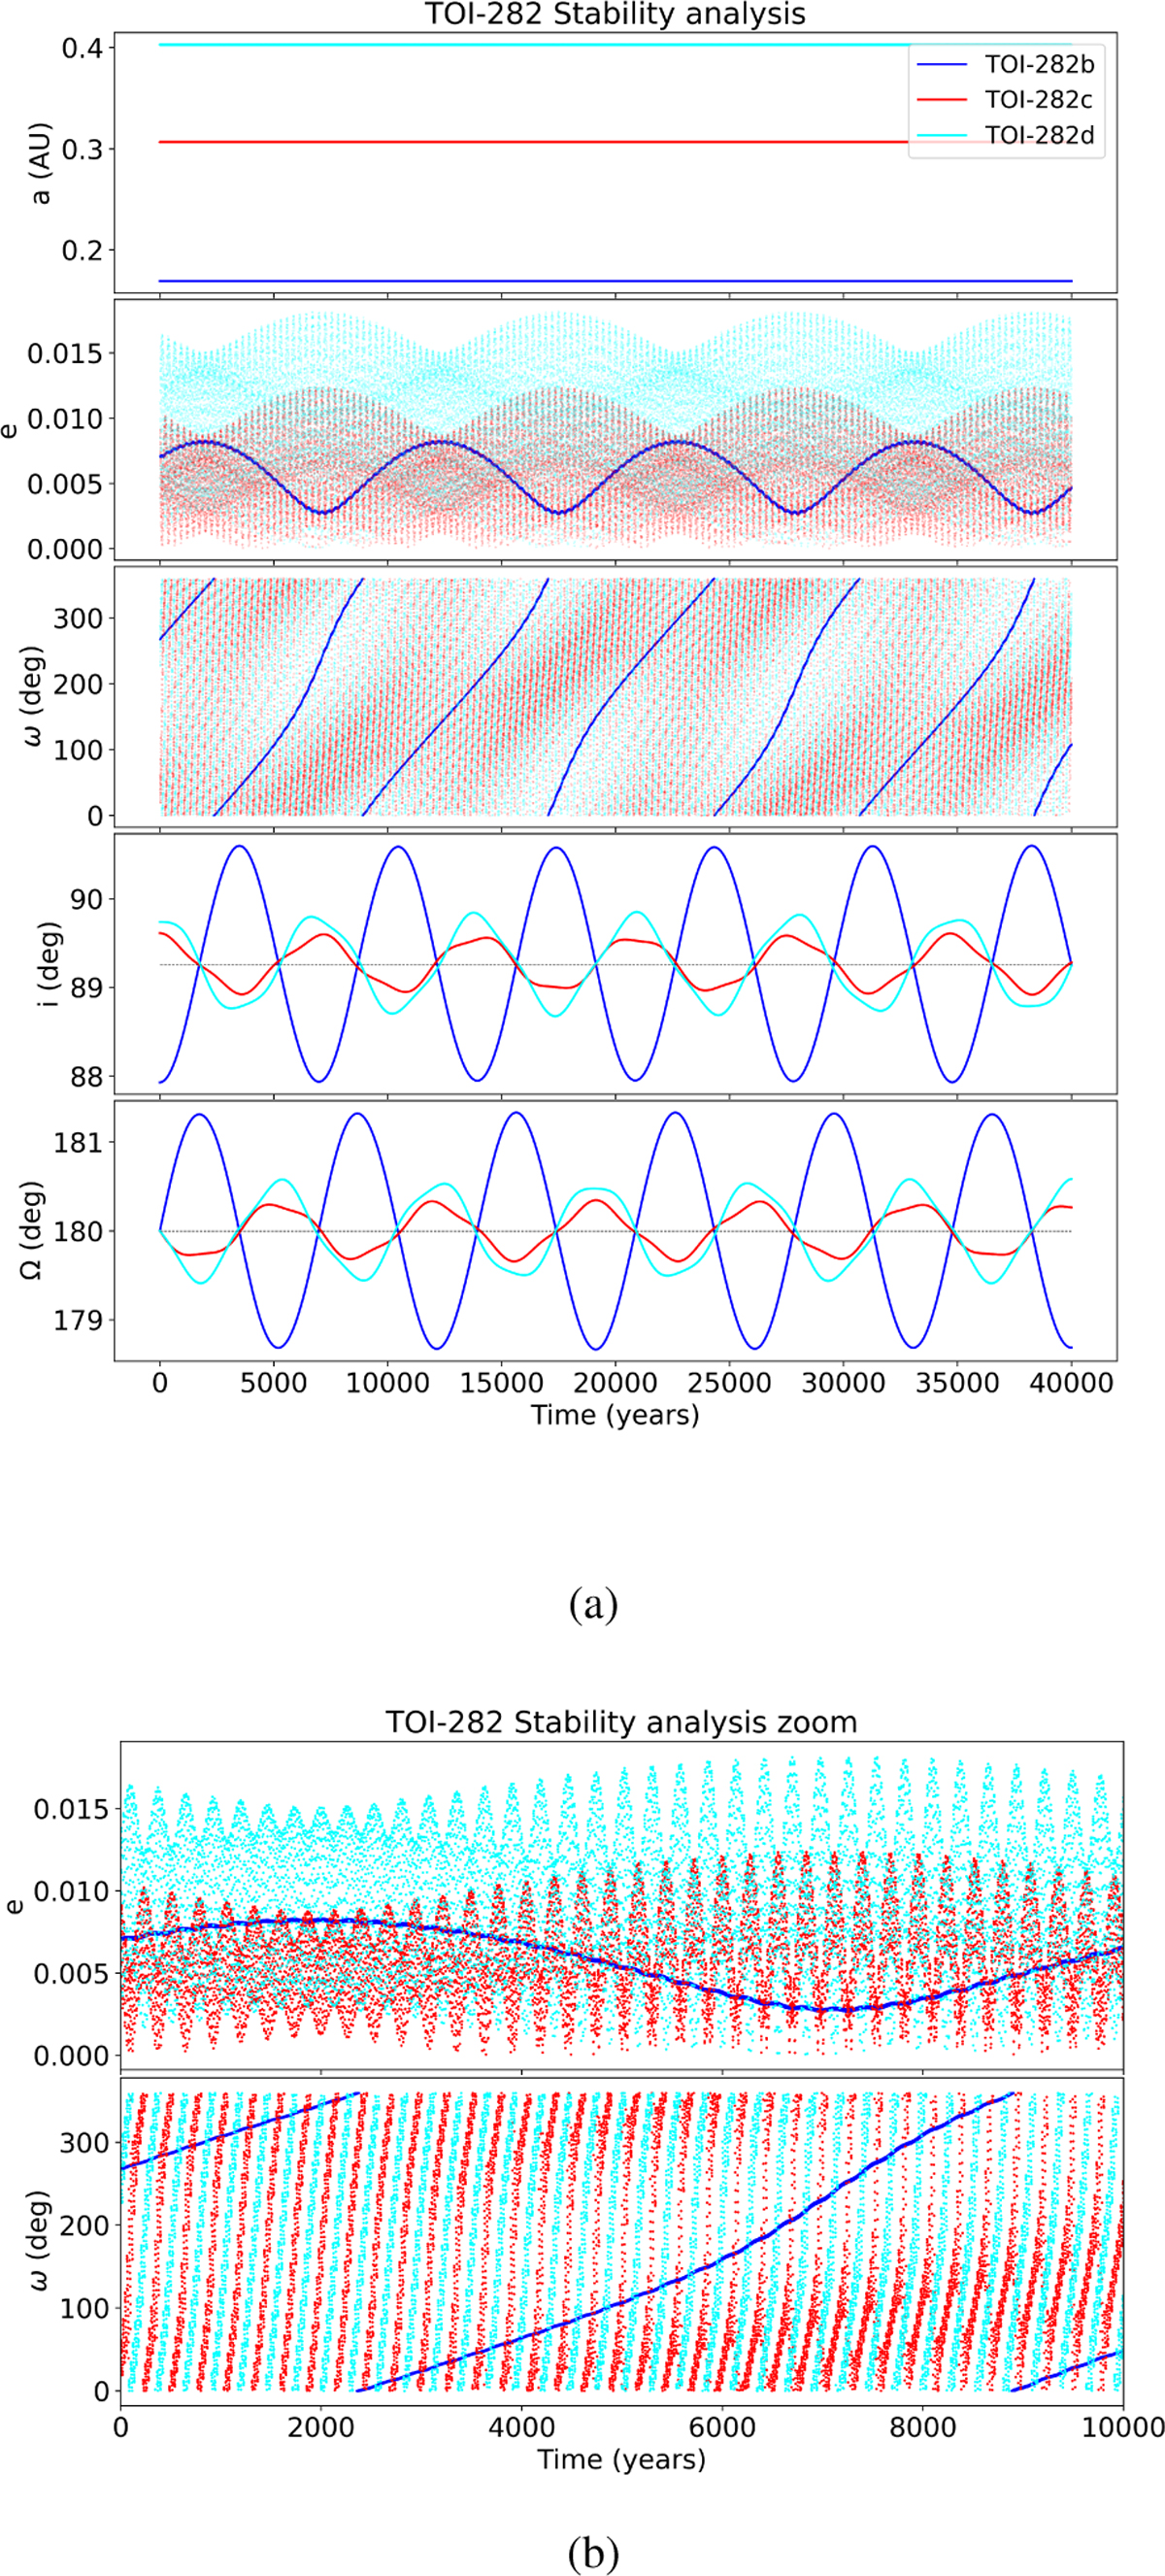
Fig. 5
Download original image
Simulated evolution of the orbital parameters over 105 years. Figure b shows a zoom over the first 104 years on the eccentricity and argument of peri-centre plots. The colours blue, red, cyan refer respectively to planets TOI-282b, TOI-282c, TOI-282d.
Current usage metrics show cumulative count of Article Views (full-text article views including HTML views, PDF and ePub downloads, according to the available data) and Abstracts Views on Vision4Press platform.
Data correspond to usage on the plateform after 2015. The current usage metrics is available 48-96 hours after online publication and is updated daily on week days.
Initial download of the metrics may take a while.