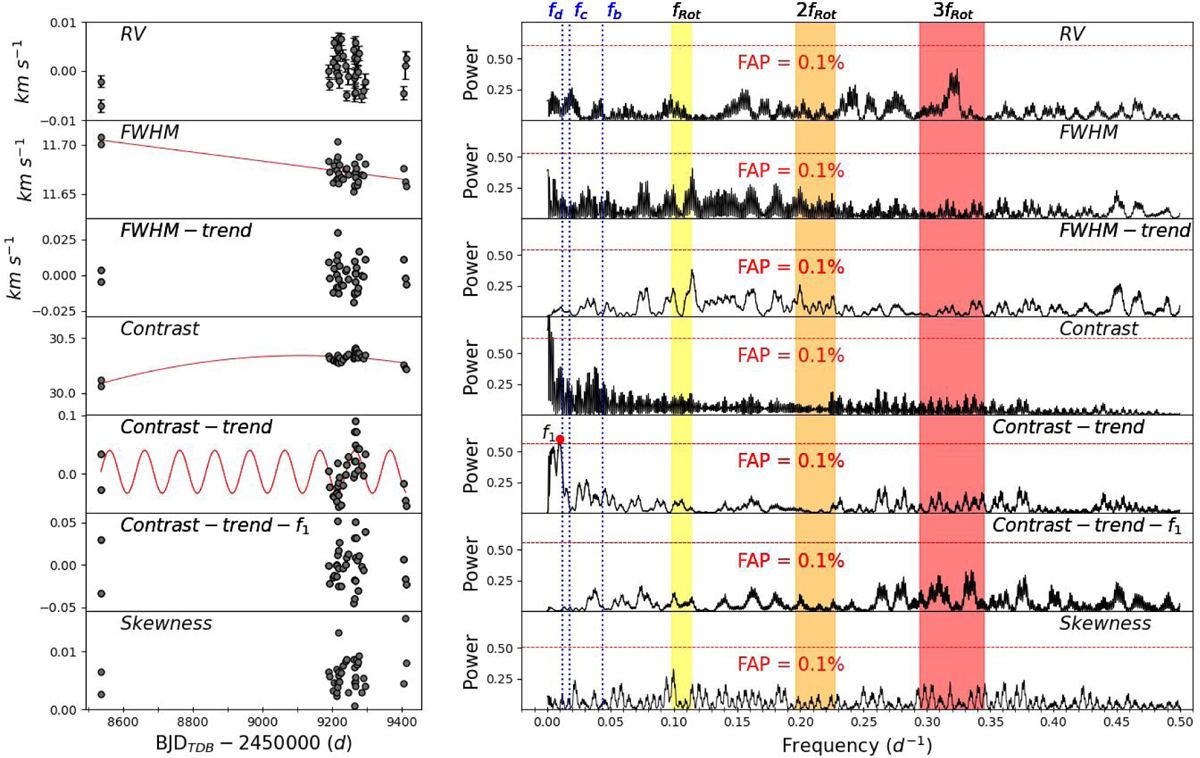
Fig. B.1
Download original image
Time series (left column) and GLS periodograms (right column) of the RV measurements and CCF profile variation diagnostics, as extracted from the HARPS spectra of TOI-282. On the left, the red curves in the second, fourth, and fifth panels represent the linear and quadratic trends, and the sine function, as derived from the best fit to the highest peak detected in the corresponding GLS periodogram. On the right, the horizontal dotted red lines mark the 0.1% false alarm probability (FAP). The shaded areas in yellow, orange, and red mark the rotation frequency frot, and its first and second harmonics (2frot and 3frot), along with their 1σ confidence intervals. The transit frequencies fb, fc, and fd of the three planets are marked with vertical blue dotted lines.
Current usage metrics show cumulative count of Article Views (full-text article views including HTML views, PDF and ePub downloads, according to the available data) and Abstracts Views on Vision4Press platform.
Data correspond to usage on the plateform after 2015. The current usage metrics is available 48-96 hours after online publication and is updated daily on week days.
Initial download of the metrics may take a while.