Fig. 1.
Download original image
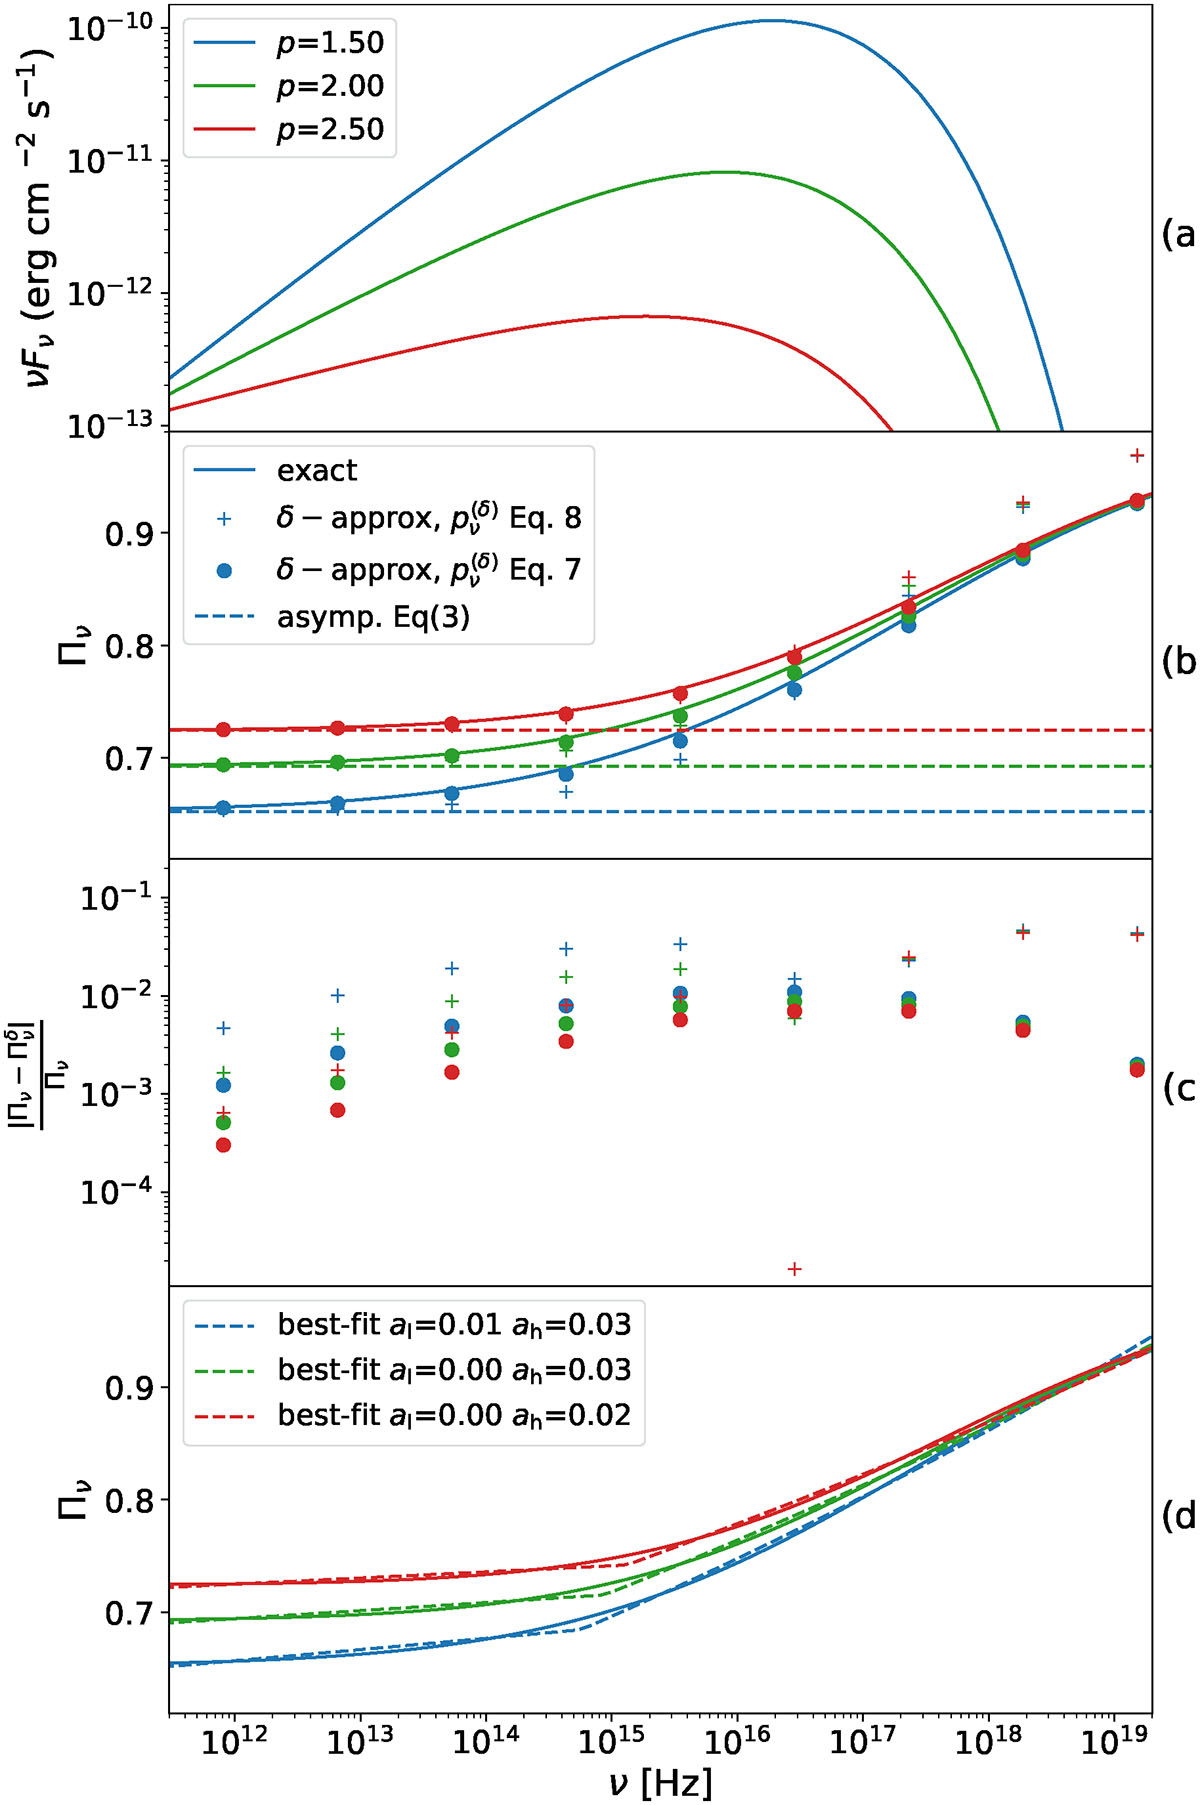
Left panels: The S SED (row a), and the corresponding fractional polarization (row b) as a function of the frequency, for a power-law cutoff EED, γcut = 5 × 10⁴, and p = [1.5, 2.0, 2.5]. The solid lines in the row b panel mark the Πνord evaluated using Eq. (1), the circles mark the δ approximation from Eq. (9) using ![]() from Eq. (7), and the crosses using
from Eq. (7), and the crosses using ![]() from Eq. (8). The dashed lines mark the asymptotic power-law trend from Eq. (3). The relative error for the δ-approximation methods, w.r.t. the exact method (row c). In the row d panel, we report the best-fit of Πνord by means of a broken power-law function.
from Eq. (8). The dashed lines mark the asymptotic power-law trend from Eq. (3). The relative error for the δ-approximation methods, w.r.t. the exact method (row c). In the row d panel, we report the best-fit of Πνord by means of a broken power-law function.
Current usage metrics show cumulative count of Article Views (full-text article views including HTML views, PDF and ePub downloads, according to the available data) and Abstracts Views on Vision4Press platform.
Data correspond to usage on the plateform after 2015. The current usage metrics is available 48-96 hours after online publication and is updated daily on week days.
Initial download of the metrics may take a while.