Fig. 11.
Download original image
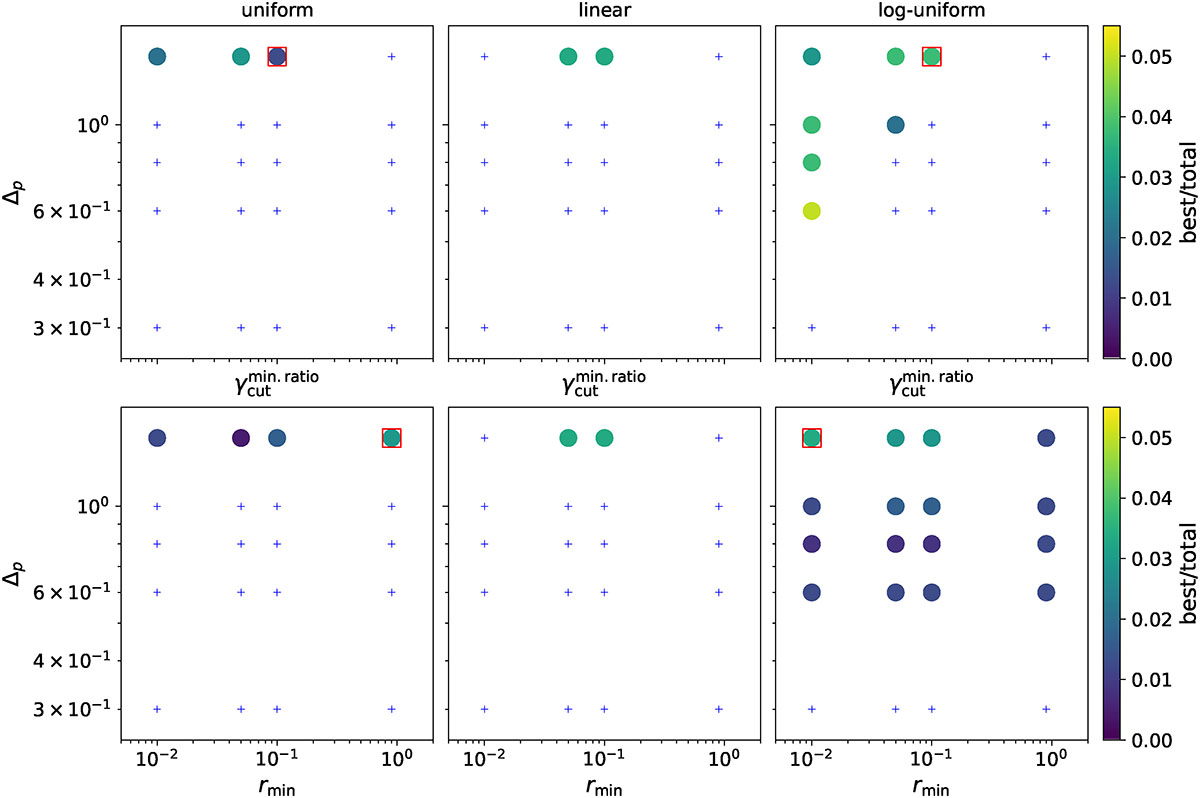
Statistical outcome of the PL-distributed MC parameter space selection. The Δp-versus-![]() parameter space is shown in the top panels, whilst the bottom panels show the Δp-versus-rmin parameter space. The three columns refer to the selected fγcut PDF. The blue crosses mark the total MC parameter space, and the filled circles the best sample parameter space. The color scale marks the ratio of the volume of best parameter space, at the coordinate reported on the x and y axes, to the total MC parameter space; both volume sizes refer to the given fγcut PDF. The red boxes mark the parameter space where the MC-averaged 1-σ dispersion of the X-ray EVPA is < 25°.
parameter space is shown in the top panels, whilst the bottom panels show the Δp-versus-rmin parameter space. The three columns refer to the selected fγcut PDF. The blue crosses mark the total MC parameter space, and the filled circles the best sample parameter space. The color scale marks the ratio of the volume of best parameter space, at the coordinate reported on the x and y axes, to the total MC parameter space; both volume sizes refer to the given fγcut PDF. The red boxes mark the parameter space where the MC-averaged 1-σ dispersion of the X-ray EVPA is < 25°.
Current usage metrics show cumulative count of Article Views (full-text article views including HTML views, PDF and ePub downloads, according to the available data) and Abstracts Views on Vision4Press platform.
Data correspond to usage on the plateform after 2015. The current usage metrics is available 48-96 hours after online publication and is updated daily on week days.
Initial download of the metrics may take a while.