Fig. 2.
Download original image
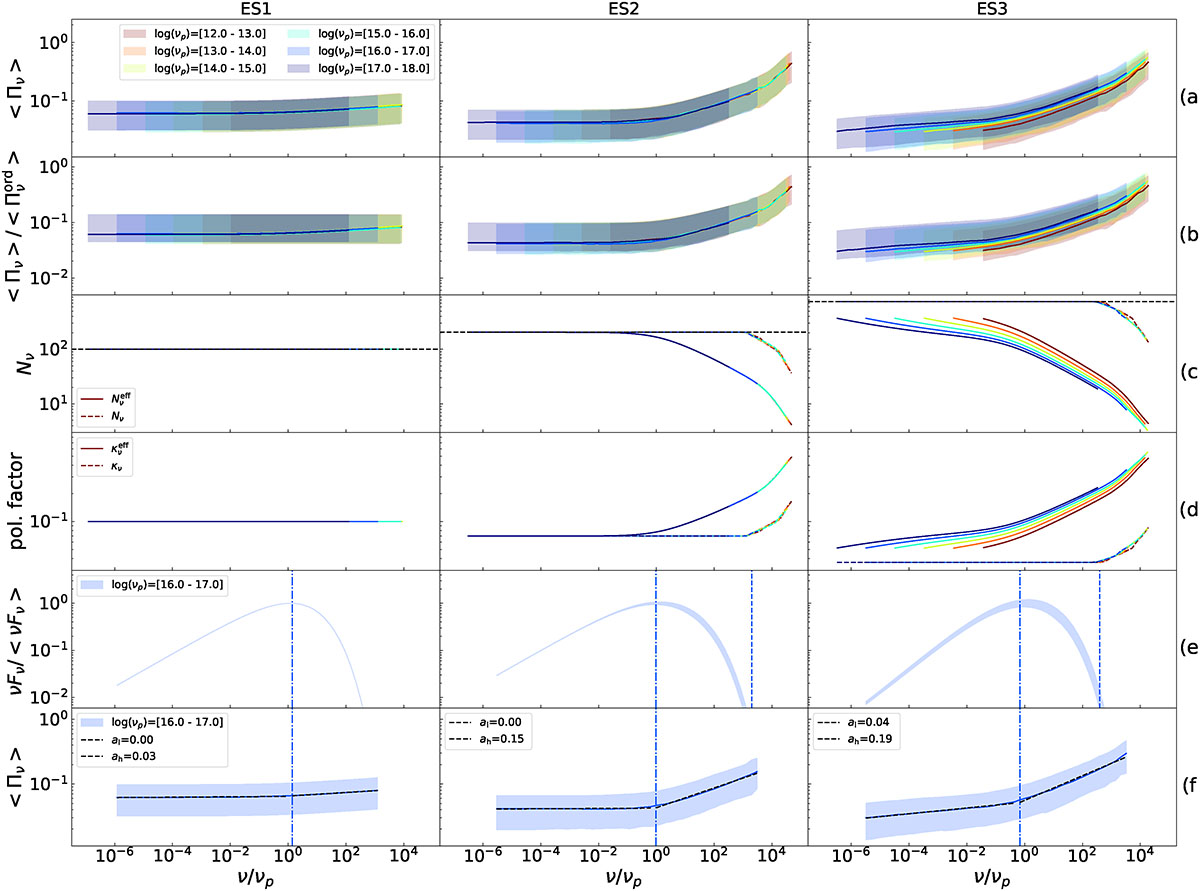
Different colors identifying the corresponding νp bins, which are the same for all the panels. Top panels: Left column: case of identical cells (configuration ES1 in Table 1). Middle column: case of configuration ES2 in Table 1, i.e. using fγcut = log-uniform. Right column: panel, case of configuration ES3, same as ES2 but adding a flat PDF, for p : fp ∼ 𝒰[1.8, 2.8]. All the trends are reported versus ν/νp. Solid lines mark the MC 0.5 quantiles and shaded areas mark the 1-σ quantiles dispersion, for the MC trials. Row a: the trend of the ratio of ⟨Πν⟩. Row b: same as for Row 1, but for trials-averaged trends for ⟨Πν⟩/⟨Πνord⟩. Row c: trials-averaged trends for Nν (dashed lines) and ![]() (solid lines). Row d: trials-averaged trends for κν (dashed line) and κνeff (solid lines). Row e: SEDs for the νp bin = [1016 − 1017] Hz, the dashed vertical line shows the ν/νp value, above which not all the cells contribute to the SED flux. The dot-dashed vertical lines mark ν = νpmin, where νpmin is the SED peak value for the lowest flux cell.
(solid lines). Row d: trials-averaged trends for κν (dashed line) and κνeff (solid lines). Row e: SEDs for the νp bin = [1016 − 1017] Hz, the dashed vertical line shows the ν/νp value, above which not all the cells contribute to the SED flux. The dot-dashed vertical lines mark ν = νpmin, where νpmin is the SED peak value for the lowest flux cell.
Current usage metrics show cumulative count of Article Views (full-text article views including HTML views, PDF and ePub downloads, according to the available data) and Abstracts Views on Vision4Press platform.
Data correspond to usage on the plateform after 2015. The current usage metrics is available 48-96 hours after online publication and is updated daily on week days.
Initial download of the metrics may take a while.