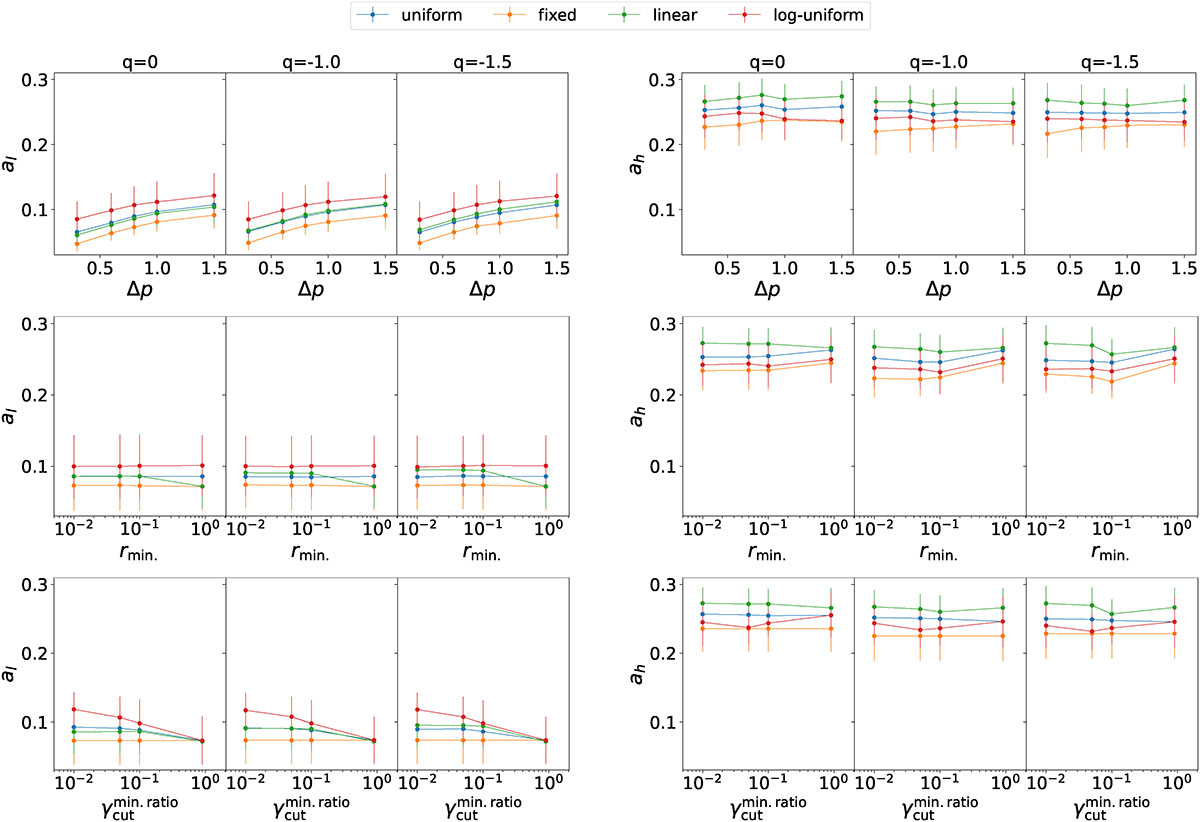
Fig. 3.
Download original image
Summary of the polarization slope trends for the PL-distributed parameter space reported in Table 2. Each subpanel refers to the three different values of q = [0, −1.0, −1.5], as reported in the subpanel title. Top panels: Low-energy (al, left panels) and high-energy (ah, right panels) polarization slopes as a function of the dispersion in the electron energy distribution index, Δp. Middle panels: al and ah as a function of the minimum cell size ratio, rmin. Bottom panels: al and ah as a function of the minimum cutoff ratio, ![]() . Different colors correspond to the different fγcut PDF reported in the top legend.
. Different colors correspond to the different fγcut PDF reported in the top legend.
Current usage metrics show cumulative count of Article Views (full-text article views including HTML views, PDF and ePub downloads, according to the available data) and Abstracts Views on Vision4Press platform.
Data correspond to usage on the plateform after 2015. The current usage metrics is available 48-96 hours after online publication and is updated daily on week days.
Initial download of the metrics may take a while.