Fig. 6.
Download original image
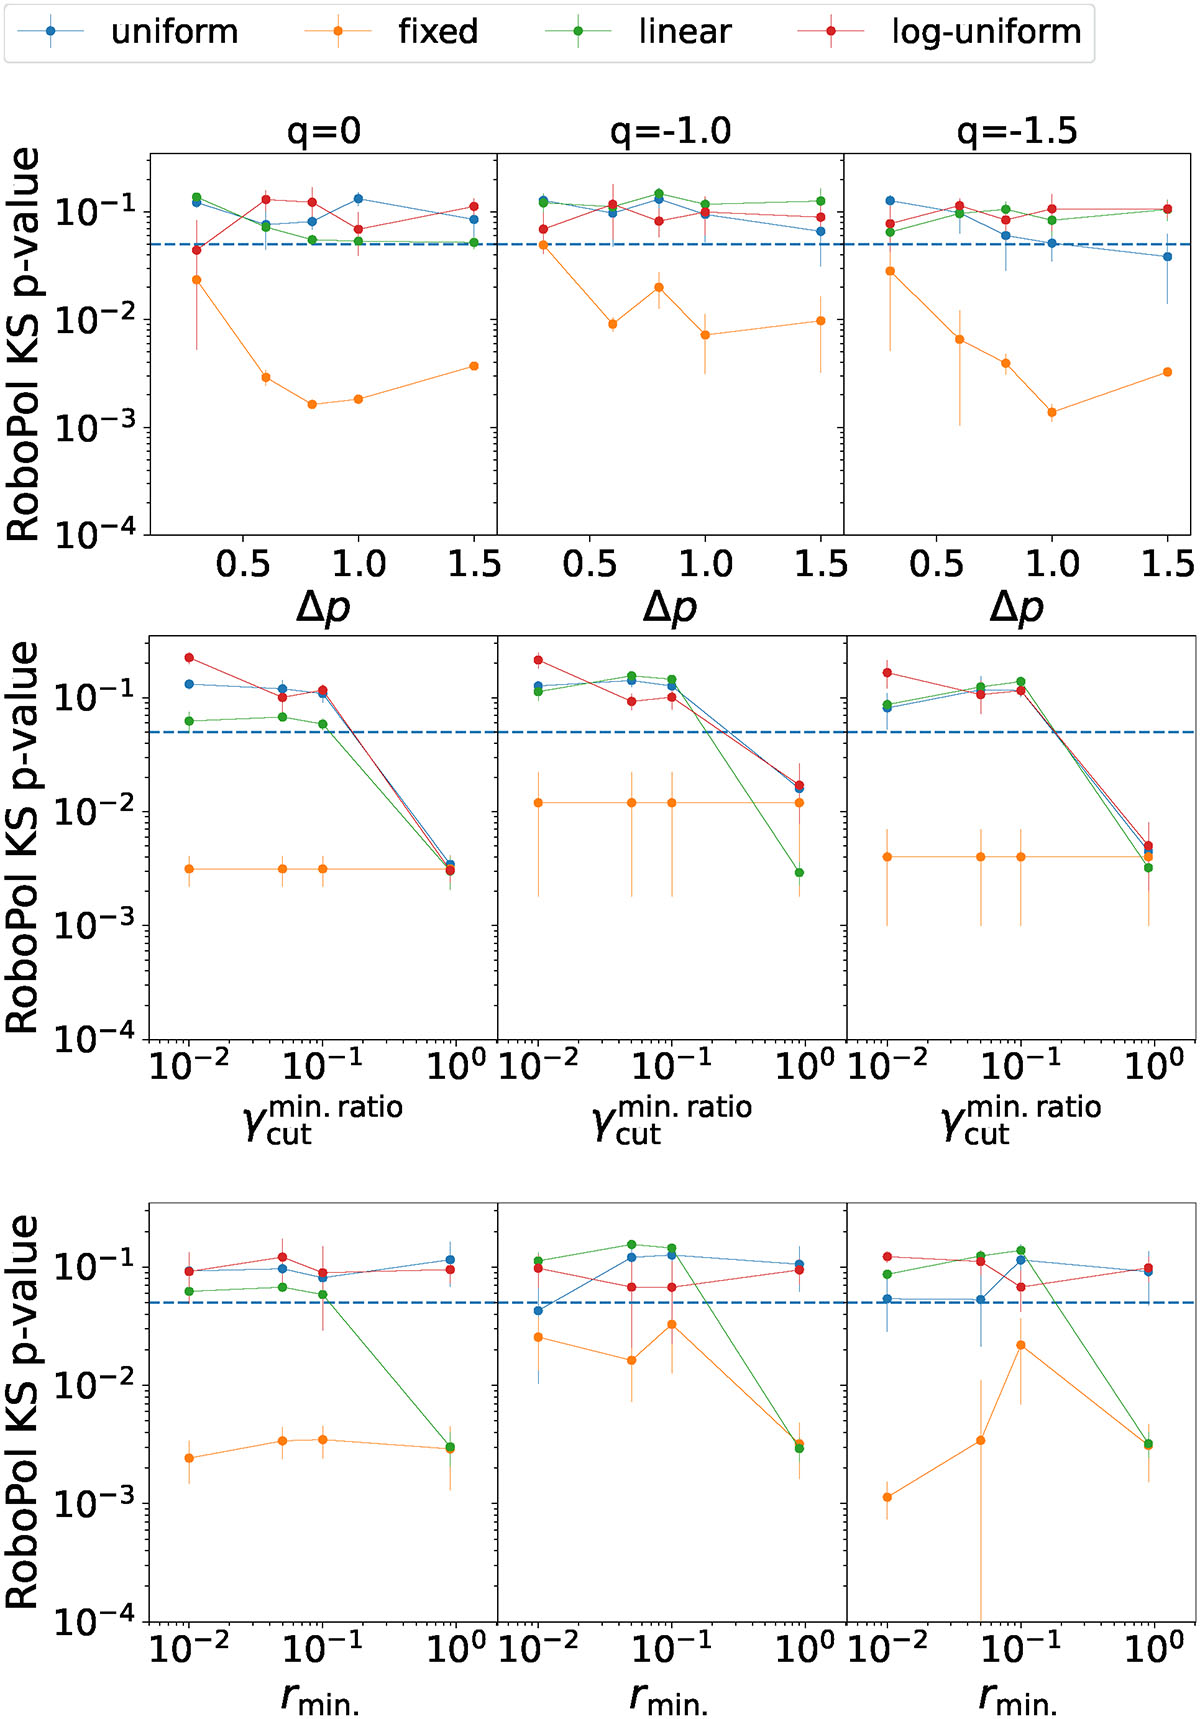
Trends of the KS test p value for the Πopt-versus-νpS limiting envelope, for the PL-distributed parameter space reported in Table 2. We report the KS trends as a function of Δp (top panels), rmin (middle panels), and ![]() (bottom panels). The left, middle, and right columns refer to the selected values of q, equal to 0, 1, and –1.5, respectively. The dashed horizontal lines mark the 0.05 p-value.
(bottom panels). The left, middle, and right columns refer to the selected values of q, equal to 0, 1, and –1.5, respectively. The dashed horizontal lines mark the 0.05 p-value.
Current usage metrics show cumulative count of Article Views (full-text article views including HTML views, PDF and ePub downloads, according to the available data) and Abstracts Views on Vision4Press platform.
Data correspond to usage on the plateform after 2015. The current usage metrics is available 48-96 hours after online publication and is updated daily on week days.
Initial download of the metrics may take a while.