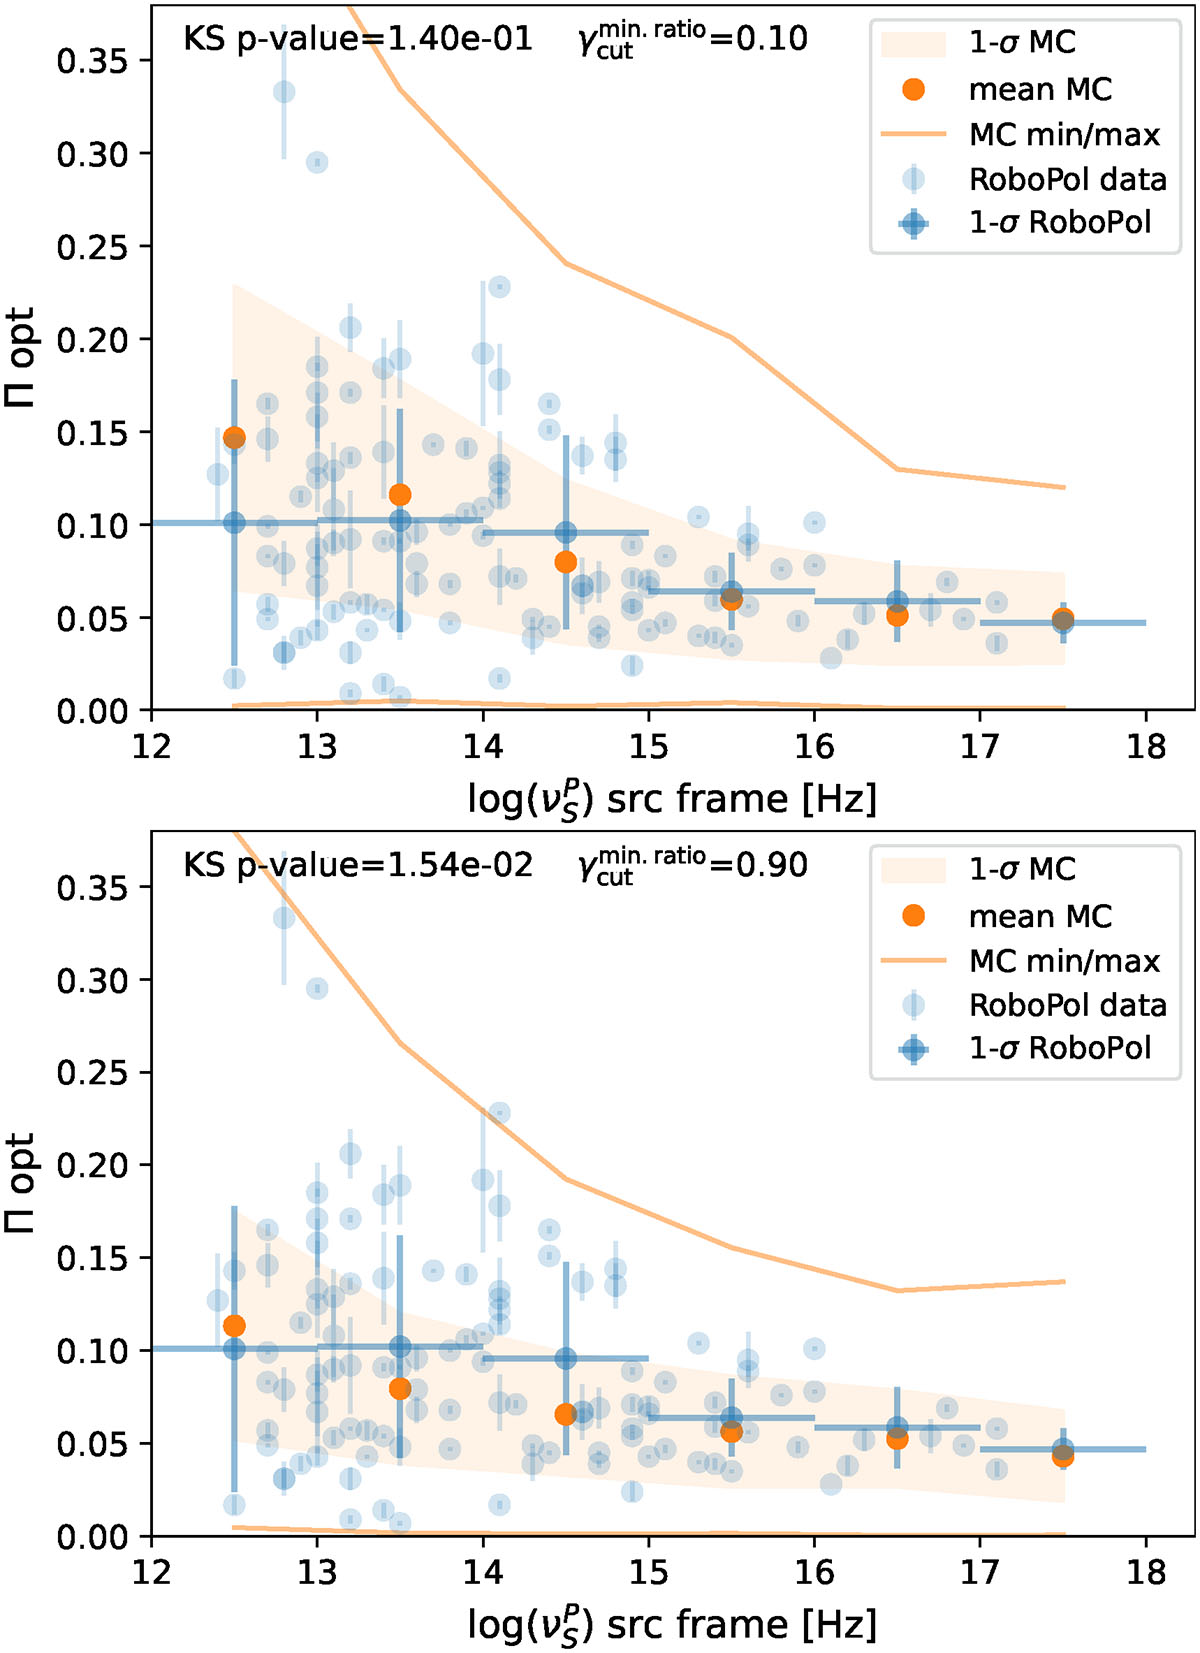
Fig. 8.
Download original image
MC Πopt-versus-νpS trend, compared to the RoboPol observed one, for the same MC run configuration as reported in Figure 7. The panels from top to bottom show the trend for increasing values of ![]() , from
, from ![]() (top panel) to
(top panel) to ![]() (bottom panels). The Πopt trend flattens for larger values of
(bottom panels). The Πopt trend flattens for larger values of ![]() , with the KS p-value decreasing from ≈0.14, for the case of
, with the KS p-value decreasing from ≈0.14, for the case of ![]() , to a p-value ≈ 0.015, for the case of
, to a p-value ≈ 0.015, for the case of ![]() .
.
Current usage metrics show cumulative count of Article Views (full-text article views including HTML views, PDF and ePub downloads, according to the available data) and Abstracts Views on Vision4Press platform.
Data correspond to usage on the plateform after 2015. The current usage metrics is available 48-96 hours after online publication and is updated daily on week days.
Initial download of the metrics may take a while.